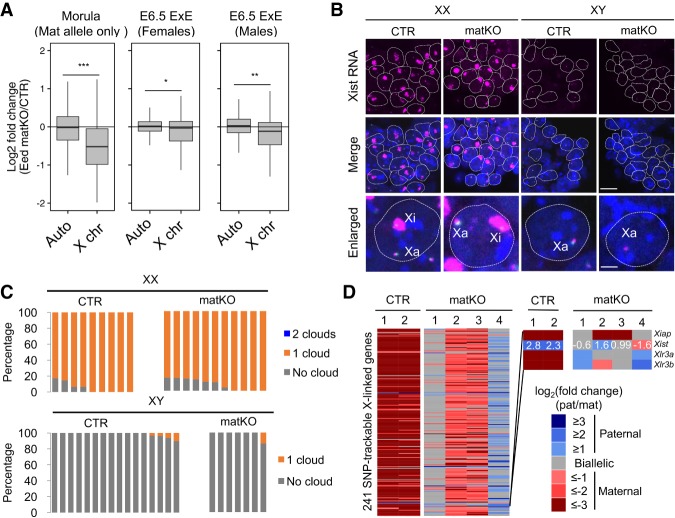
Figure 4.
Aberrant XCI is restored in E6.5 Eed matKO embryos. (A) Box plot showing the relative expression of autosomes and X-linked genes between CTR and Eed matKO of morula embryos and E6.5 ExEs. The middle lines in the boxes represent the medians. Box edges and whiskers indicate the 25th/75th and 2.5th/97.5th percentiles, respectively. (***) P < 1.2 × 10−44; (**) P < 5.5 × 10⁻¹⁸; (*) P < 4.1 × 10⁻⁷, Mann-Whitney-Wilcoxon test. (B) Representative images of Xist RNA FISH in ExEs of female (XX) and male (XY) E6.5 embryos. (Blue) DAPI. Bars: merged images, 20 µm; enlarged images, 5 µm. (Xa) Active X chromosome. (C) The ratio of blastomeres showing the indicated number of Xist RNA clouds. Each bar represents an individual embryo. The numbers of embryos examined were nine CTR and 11 matKO for females and 16 CTR and seven matKO for males. (D) Heat map showing the allelic expression bias of X-linked genes in ExEs of female E6.5 embryos. CTR and Eed matKO groups contained two and four ExE samples, respectively. Genes with >20 SNP reads are shown. The right panel indicates a zoomed-in sector of Xist to demonstrate the anti-correlation of allelic expression of Xist and the other X-linked genes. The numbers inside the Xist row represent the actual values of log2 fold change (paternal/maternal).

