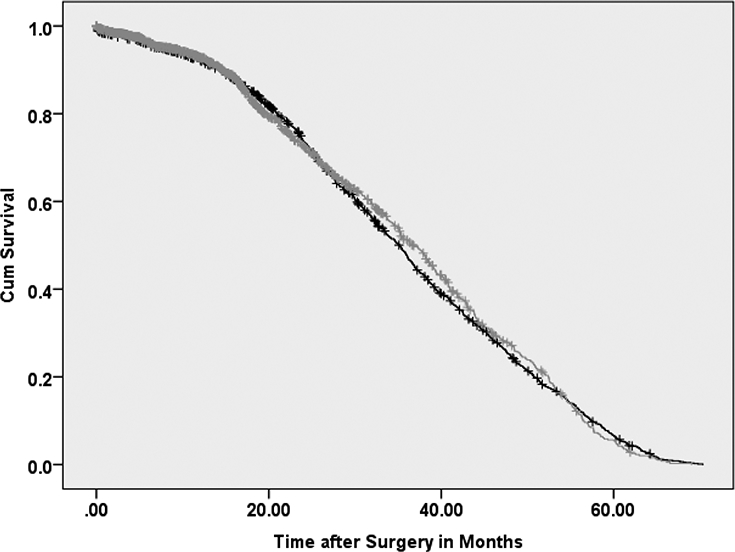
Figure 2.

Kaplan-Meier survival curve for patients with clinical N+ who had lymphadenectomy (yes=gray/no=black) and patients with no lymphadenectomy
Log Rank Test p value=0.90, Lymphadenectomy yes vs. no

Kaplan-Meier survival curve for patients with clinical N+ who had lymphadenectomy (yes=gray/no=black) and patients with no lymphadenectomy
Log Rank Test p value=0.90, Lymphadenectomy yes vs. no