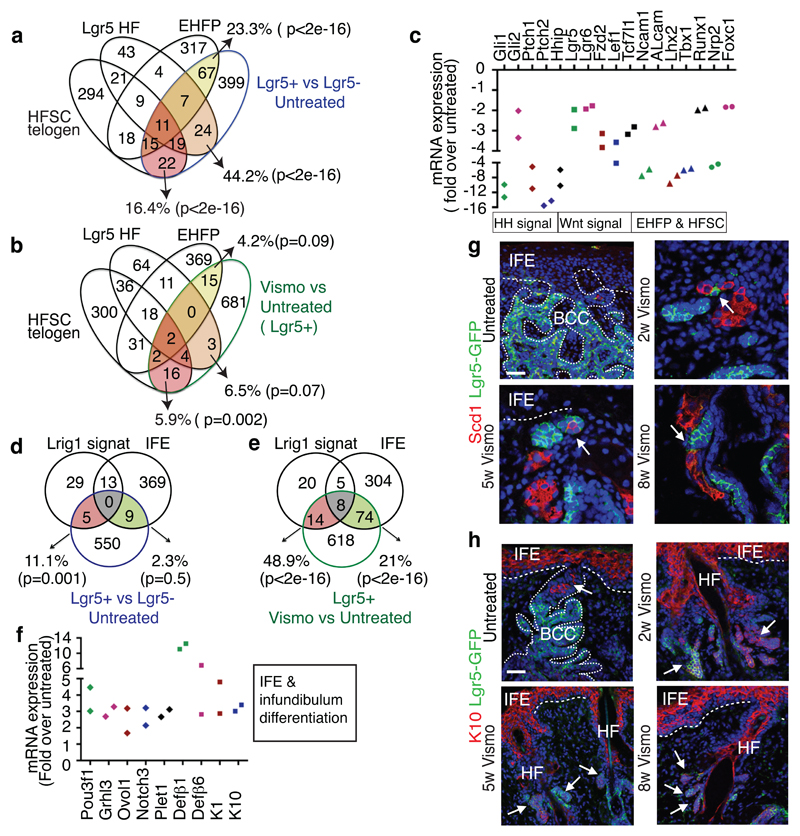
Fig. 3. Vismodegib promotes BCC differentiation.
(a-b) Venn diagram showing the similarities and the differences from 2 independent microarray experiments between the genes upregulated more than two-fold in Lgr5+Lrig1+ vs. Lgr5-Lrig1+ (a) or in Lgr5+Lrig1+ cells vismodegib treated vs. untreated (b) with the telogen HFSC signature16, HF Lgr5-expressing cells signature17 and EHFP signature15. (c) mRNA expression of HF genes downregulated in Lgr5+Lrig1+ cells 8 weeks following vismodegib administration (n=2 independent microarray experiments). (d-e) Venn diagrams showing the similarities and the differences between the genes differentially upregulated more than two-fold from 2 independent microarray experiments in Lgr5+Lrig1+ vs. Lgr5-Lrig1+ (d) or in Lgr5+Lrig1+ TCs vismodegib treated vs. untreated (e) compared to IFE16 and Lrig113 signatures. (f) mRNA expression of IFE and infundibulum genes upregulated in Lgr5+Lrig1+ cells 8 weeks following vismodegib administration (n=2 independent microarray experiments). (g) Immunostaining for GFP and Stearoyl-CoA desaturase-1 (Scd1) in untreated and vismodegib-treated Ptch1cKO/Lgr5-DTR-GFP mice. Arrow indicates areas of SG differentiation. (h) Immunostaining for GFP and K10 in untreated and vismodegib-treated Ptch1cKO/Lgr5-DTR-GFP mice. Arrow indicates differentiation of Lgr5+ TCs into K10-expressing cells. Three independent experiments per condition were analysed showing similar results in g and h. Hoechst nuclear staining in blue; scale bars, 50 μm. Dashed line delineates basal lamina. p value calculated using the hypergeometric test for each intersection of two subsets of genes with phyper function in R software, in a, b, d and e.

