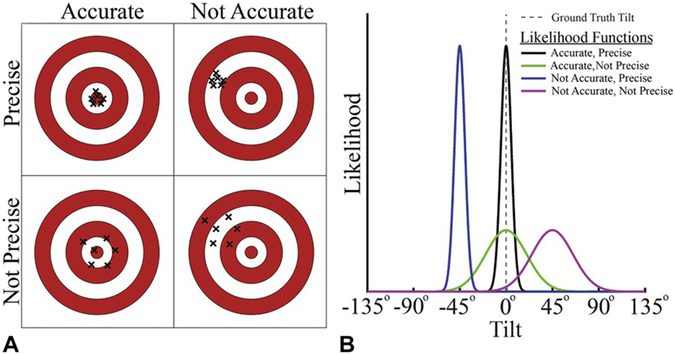
Fig. 3.1.
Accuracy and precision of sensory representations. (A) Dartboard schematic illustrating four accuracy–precision scenarios. Accuracy describes how close the representation is to the ground truth (the bullseye). Performance is accurate if, on average, the dart hits the bullseye (left column). Precision describes the reliability of the representation. Performance is precise if multiple dart throws result in a tight cluster (top row). As is illustrated here, accuracy and precision can vary independently. (B) Sensory representations can be described as likelihood functions. Given a ground truth tilt of 0° (vertical dotted gray line), each curve shows a Gaussian-shaped likelihood function with different levels of accuracy and precision. The horizontal axis shows the possible tilts, and the vertical axis indicates the likelihood of sensing each of those tilts given the ground truth tilt of 0°.

