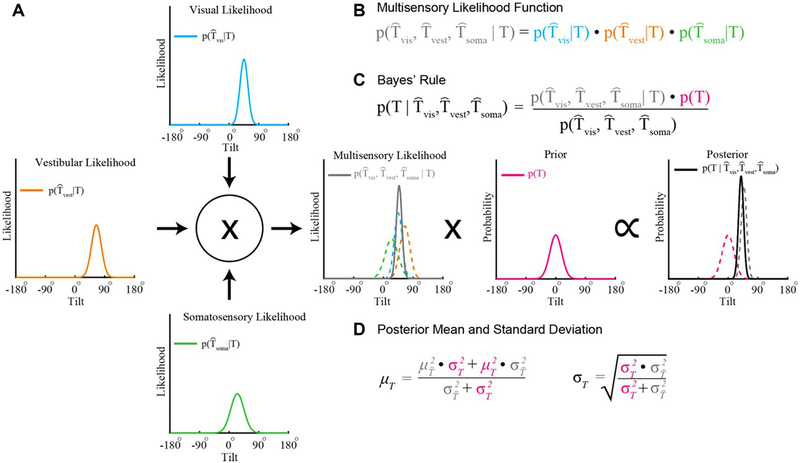
Fig. 3.2.
Bayesian cue integration. (A) The visual, vestibular, and somatosensory systems each provide a representation of tilt modeled here as Gaussian likelihood functions. For example, the visual likelihood function describes the likelihood of visually sensing a particular tilt given the true tilt (T). The mean and standard deviation characterize the accuracy and precision of the representation, respectively. (B) The product of the individual sensory likelihoods produces a multisensory likelihood function (solid gray curve in the center plot; colored dashed curves show the unisensory likelihood functions). (C) According to Bayes’ rule, the posterior distribution describes the probability of a tilt given the sensory information (black curve, right-most plot). The posterior is equal to the product of the multisensory likelihood function and a prior describing the probability of each tilt (magenta curve, center-right plot), divided by a normalizing term (that can be safely ignored since it does not affect the shape of the posterior distribution). (D) The posterior has a mean that is equal to a weighted combination of the multisensory likelihood mean and the mean of the prior, and has minimal variance given the likelihood and prior. Colors in the equations correspond to the colors of the plotted functions.

