Fig. 3.5.
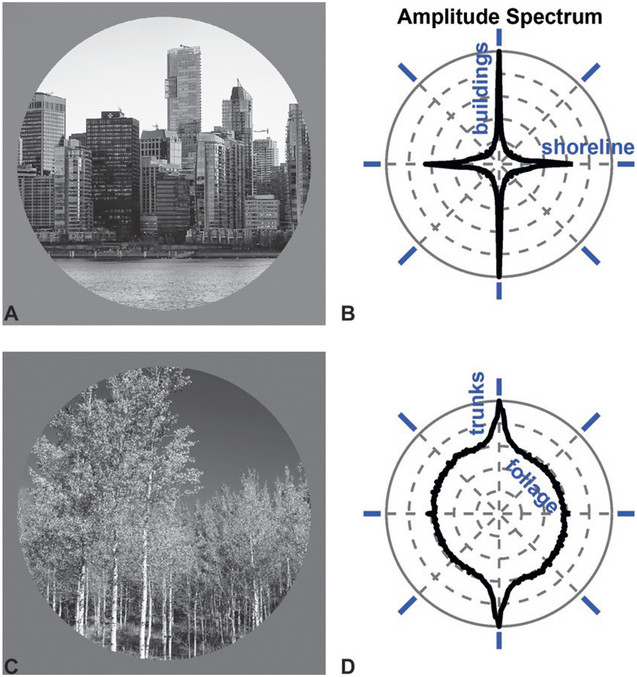
The distribution of orientations in the environment provides a visual cue to the direction of gravity. (A) Urban scene: the Vancouver skyline. (B) Amplitude spectrum of the urban scene shows a prevalence of vertical orientations due to the columnar structure of the buildings, and horizontal orientations due to the roofs and floors of the buildings as well as the shoreline. The angular variable corresponds to the orientation of the contours in the scene, indicated by blue oriented bars. The radial variable shows the prevalence of each orientation in the scene. (C) Natural scene: Logan Canyon, UT. (D) Amplitude spectrum of the natural scene shows a prevalence of vertical orientations due to the tree trunks.

