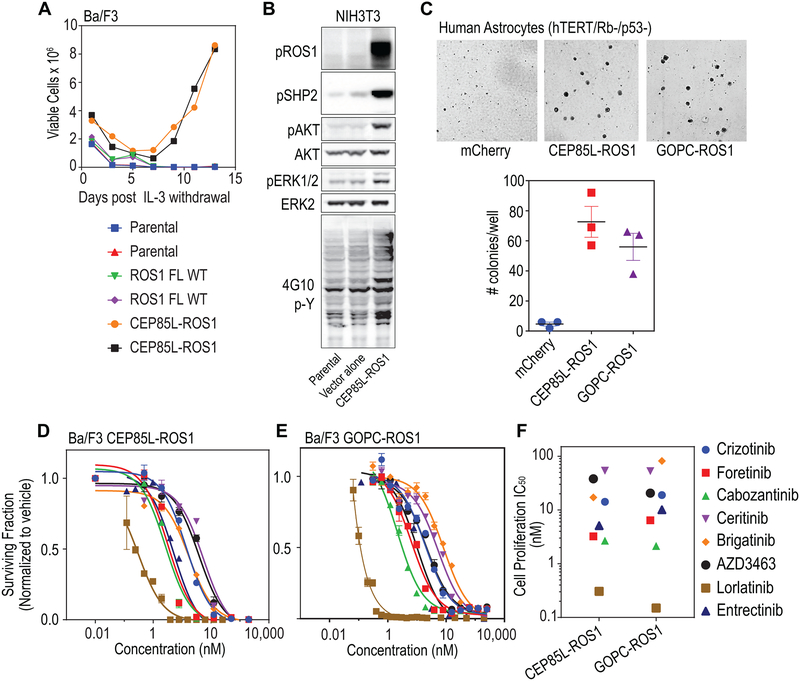
Figure 3. CEP95L-ROS1 and GOPC-ROS1 transform human astrocytes and respond to ROS1 kinase inhibitors.
A. Graph depicts data from an interleukin-3 (IL-3) withdrawal assay showing that ectopic expression of CEP85L-ROS1 & GOPC-ROS1 but not native full length ROS1 permits sustained outgrowth of Ba/F3 cells in the absence of IL-3. Parental indicates untransduced Ba/F3 cells (negative control). B. Immunoblot analysis shows ectopic expression of CEP85L-ROS1 upregulates phospho-tyrosine signaling (4G10, generic p-Tyr antibody), as well as canonical ROS1- effector pathway signaling (phosphorylation of SHP2 (pSHP2), AKT (pAKT), ERK1/2 (pERK1/2) in NIH3T3 murine fibroblasts. C. Soft-agar colony forming assay data shows that expression of CEP85L-ROS1 and GOPC-ROS1 confers neoplastic properties to human astrocytes with deficiency in TP53 and RB. Upper panel: representative images; lower panel: quantification of number of colonies. D. Dose response proliferation assay of Ba/F3 CEP85L-ROS1 and, (E) GOPC-ROS1 cells after 72 hour exposure to crizotinib, foretinib, cabozantinib, ceritinib, brigatinib, AZD3463, lorlatinib and entrectinib. Data are normalized to vehicle-treated control, and values shown are the mean ± SEM. (F) Scatter plot of cell proliferation IC50 values for each TKI against Ba/F3 cells. Colored symbols represent different inhibitors as shown on the right.

