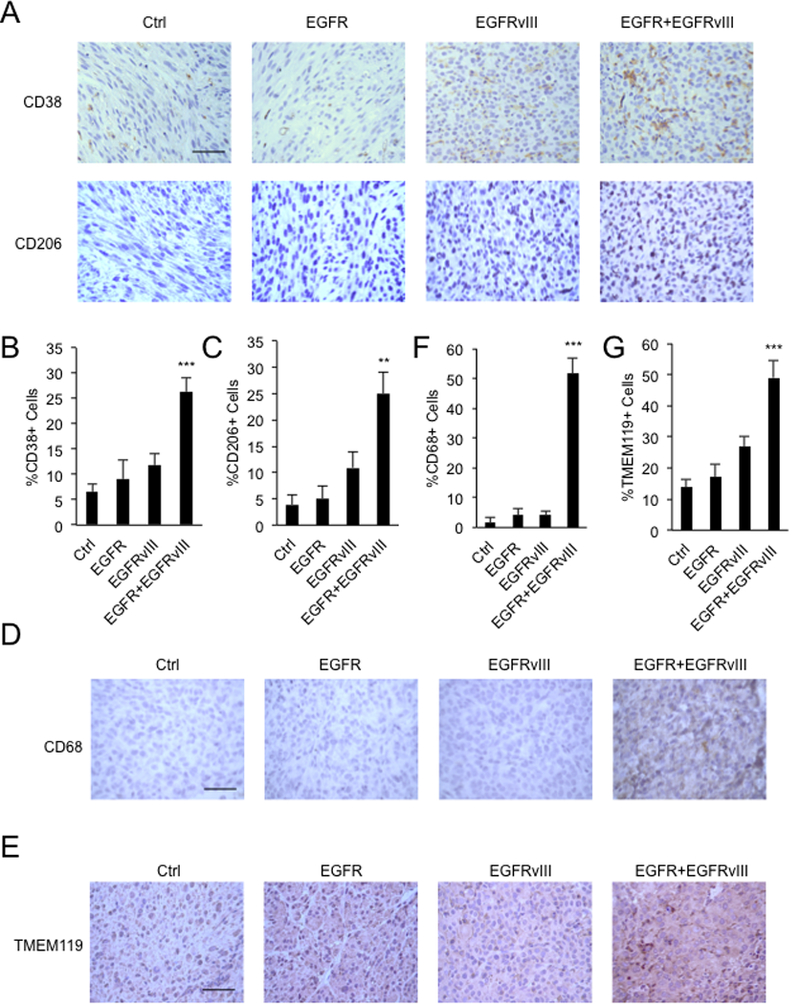
Figure 2.

Co-expression of EGFR and EGFRvIII leads to infiltration of M1, M2 macrophages and microglia. A, IHC staining validating increased numbers of CD38 and CD206 positive cells in intracranial xenografts driven by EGFR and EGFRvIII; B and C, quantification. D, IHC staining validating increased numbers of CD68 positive cells in flank xenografts driven by EGFR and EGFRvIII; E, IHC staining validating increased numbers of TMEM119 positive cells in intracranial xenografts driven by EGFR and EGFRvIII; F and G, quantification.**, p<0.01, ***, p < 0.001. Scale bar: 50μM.
