Figure 4.

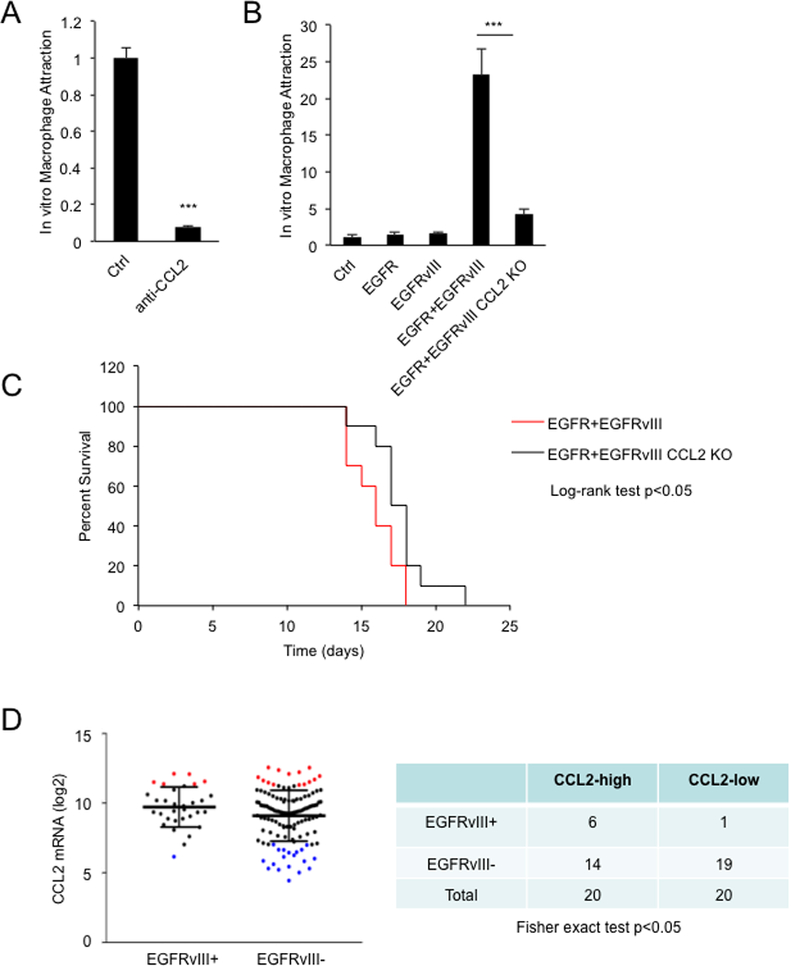
EGFR and EGFRvIII induce macrophage attraction through upregulating CCL2. A, Depletion of CCL2 in conditioned media from U87 cells expressing EGFR and EGFRvIII decreased attraction of MV-4–11 (antibody concentration: 1μg/ml). B, Knockout of CCL2 decreased attraction of MV-4–11. C, Kaplan-Meier curve of nude mice bearing intracranial xenografts of indicated cell lines. D, CCL2 expression levels were plotted according to EGFRvIII status in glioblastoma patient samples (TCGA). Red dots: 20 samples with highest expression of CCL2 mRNA. Blue dots: 20 samples with lowest expression of CCL2 mRNA. Macrophage attraction levels were normalized to the control cell line. Results were reproduced in three independent experiments with triplicate samples. ***, p< 0.001.
