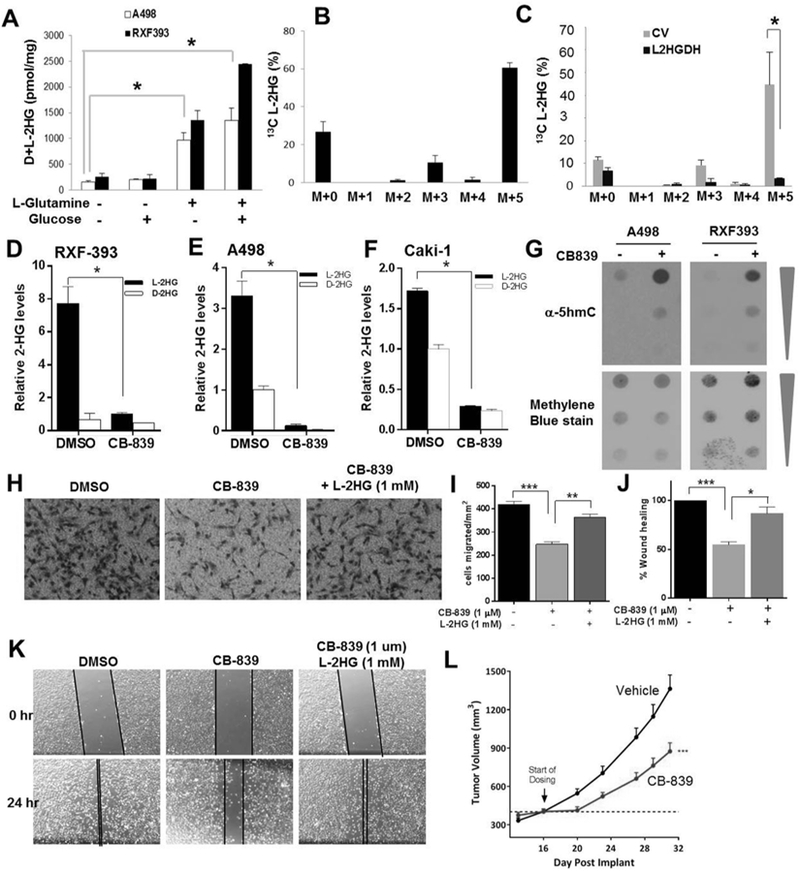
Figure 3. The role of glutamine in L-2-HG metabolism.

(A) A498 and RXF-393 cells were incubated in media containing either 5mM Glucose and/or 2mM L-Glutamine for 24 h. Total 2-HG level was measured. (B) L-2-HG isotopologue analysis showing abundance of 13C labelled L-2-HG in A498 cells starved for glutamine for 4 hrs and treated with 2mM 13C5 L-glutamine for 6 hrs. (C) L-2-HG isotopologue analysis showing abundance of 13C labelled L-2-HG in A498 cells (control and L2HGDH) starved for glutamine for 4 hrs and then incubated with 2mM 13C5 L-glutamine for 6 h. (D-F) Relative L-2-HG and D-2-HG levels of A498 (D), RXF-393 (E), and Caki-1 (F) RCC cells treated with glutaminase inhibitor CB-839 (1 µM) for 72 hrs. (G) Dot blot analysis of 5hmc levels in A498 and RXF-393 cells treated with CB-839 (1 µM) for 72 hrs. Upper panel: immunoblot for 5hmc. Bottom panel: methylene blue (MB) staining for total gDNA. (H-K) Caki-1 cells were treated with CB-839 (1 µM) for 48 hrs with or without L-2-HG (1 mM). Cells were harvested and then assessed for migration via Boyden chamber assay (panels H,I) and scratch assay (panels J,K). Data shown are the means ± SEM of two independent experiments (n=3/groups). (L) Growth curve of Caki-1 tumor xenografts in nude mice treated with vehicle or CB-839.
