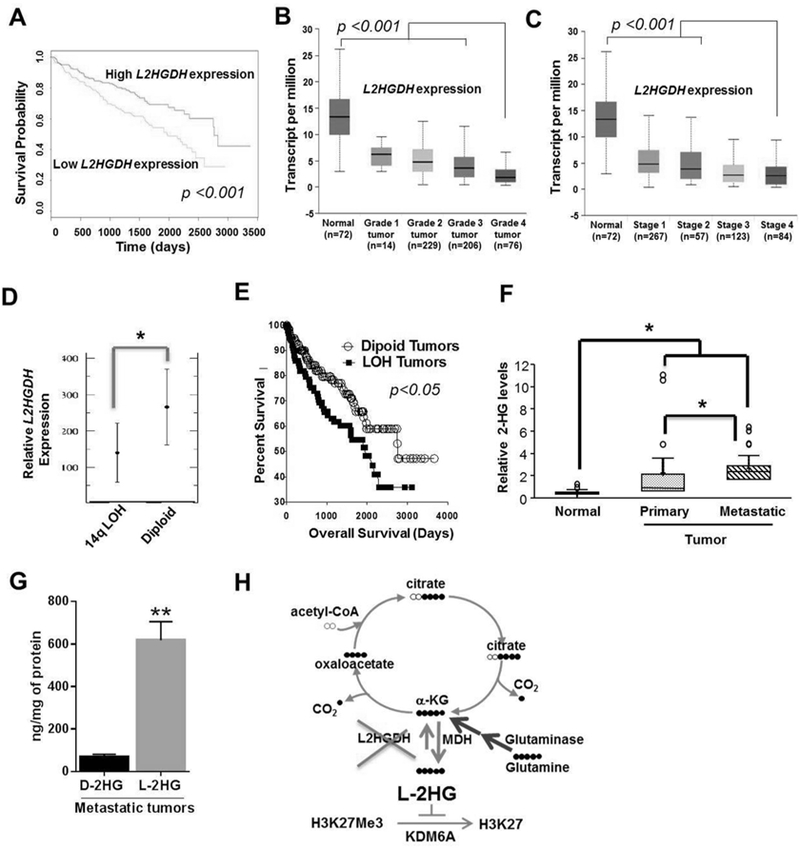
Figure 6. Prognostic Significance of L2HGDH expression in RCC patients.

(A) Kaplan-Meier survival curve analysis in patients from TCGA data set with tumors expressing low L2HGDH mRNA expression (bottom 50%) relative to patients with tumors with high L2HGDH expression (upper 50%). Expression of L2HGDH (transcript per million) in increasing grades (Grade 1–4) (B) and stages (Stage 1–4) (C) of kidney tumors of patients from TCGA data set. (D) Relative L2HGDH mRNA expression as a function of 14q LOH. Data extracted from Sato et al. (E) Percentage survival curve of patients from TCGA data set as a function of L2HGDH copy number. (F) Relative total (D+L)-2-HG levels in normal, primary and metastatic kidney RCC deposits. (G) D-2-HG and L-2-HG levels in metastatic tumor deposits (n=3). (H) Graphical representation of biochemical axis of L-2-HG accumulation in RCC and therapeutic potential of glutaminase and MDH inhibitors to lower L-2-HG. (* indicates p <0.05 and ** indicates p <0.01).
