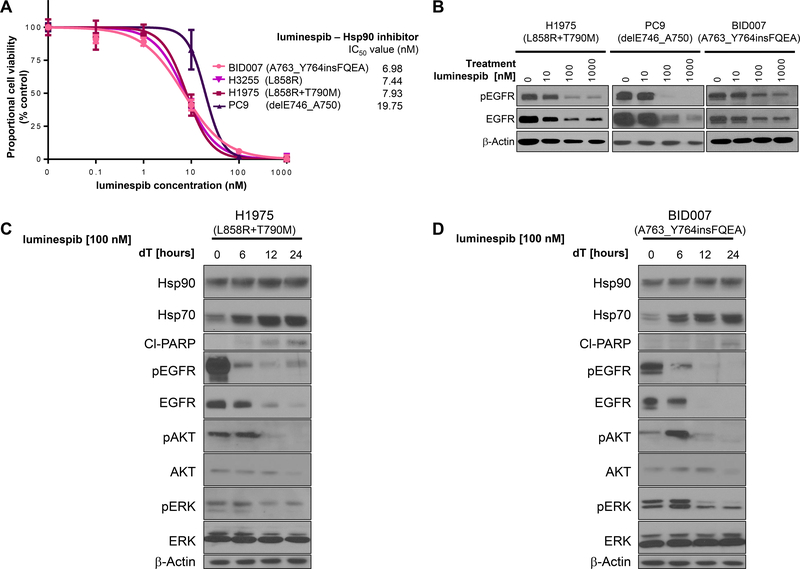
Figure 3. EGFR exon 20 mutated NSCLC cell lines are inhibited by the Hsp90 inhibitor luminespib.
A. Dose-inhibition curves and standard deviations of 3 experiments for luminespib using NSCLCs cell lines harboring different EGFR mutations (as indicated) as driver oncogenes after 72 hours, using nanomolar (nM) concentrations indicated. Mean IC50 value is indicated in ascending order. B. Western blot results showing the intracellular signaling effects of increasing concentrations of luminespib after 24 hours of exposure in H1975, PC9 and BID007 as indicated. Immunoblotting was performed against indicated proteins, EGFR (phospho [p] and total) and β-actin. C. and D. Time course of alterations in Hsp90 and EGFR plus their targets after inhibition with up to 24 hours of luminespib (as indicated) in H1975 cells (C) and BID007 cells (D). Immunoblotting was performed against indicated proteins: Hsp90, Hsp70, PARP (cleaved [Cl]), EGFR (phospho [p] and total), AKT (p and total), ERK (p and total) and β-actin.

