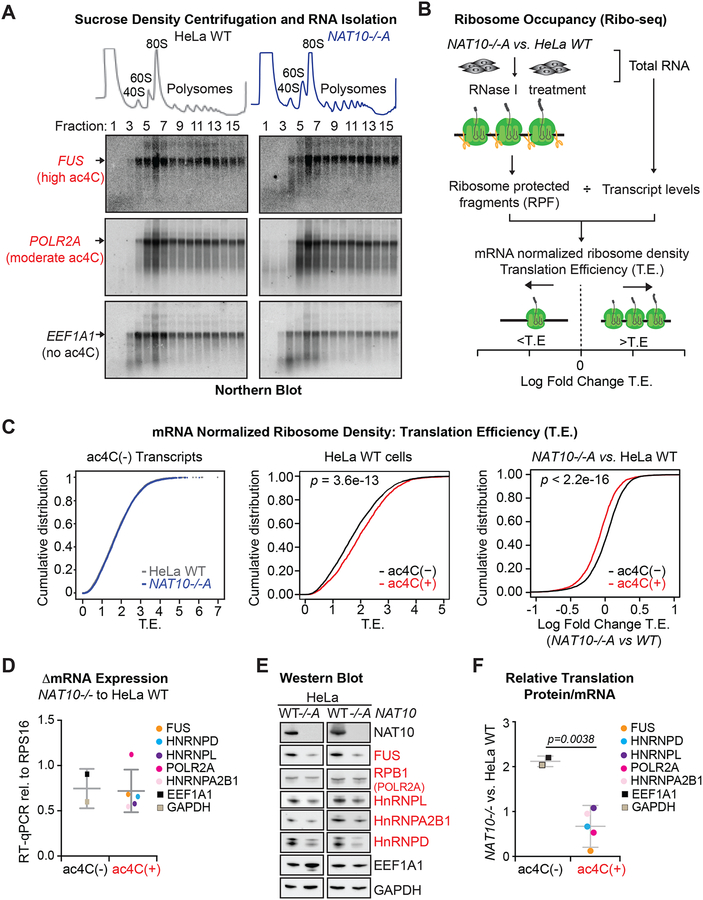
Figure 6. ac4C enhances translation efficiency.
(A) Absorbance at 254 nm in sucrose density gradient fractions from parental and NAT10−/−A HeLa cells (top). Total RNA isolated from each fraction was hybridized to probes specific for two ac4C(+) transcripts, FUS and POLR2A, and an ac4C(−) transcript, EEF1A1 (bottom). Blots are representative of biological triplicates.
(B) Schematic of Ribo-seq.
(C) CDF plots of mRNA-normalized ribosome footprint reads (T.E.) for ac4C(−) transcripts in NAT10−/−A and parental HeLa cells (left); ac4C(−) and ac4C(+) transcripts in HeLa WT cells (middle), or in NAT10−/−A vs. HeLa WT (right). ac4C(−), n=5445; ac4C(+), n=1733. p = KS test.
(D) RT-qPCR for differential expression of determined ac4C(−) and ac4C(+) mRNAs in NAT10−/−A and HeLa WT cells. Dots represent the mean from three biological replicates. Error bars depict the average and SD within ac4C(+) and ac4C(−) transcripts.
(E) Representative Western blots of proteins associated with ac4C(+) and ac4C(−) transcripts from parental and NAT10−/−A HeLa cells.
(F) Relative translation of select ac4C(+) and ac4C(−) transcripts as determined through the change in protein expression compared to the change in mRNA expression in NAT10−/− vs. parental HeLa cells. Dots represent the mean delta T.E. from three biological replicates. Error bars depict the average and SD within ac4C(+) and ac4C(−) transcripts. Two-tailed student’s t-test.

