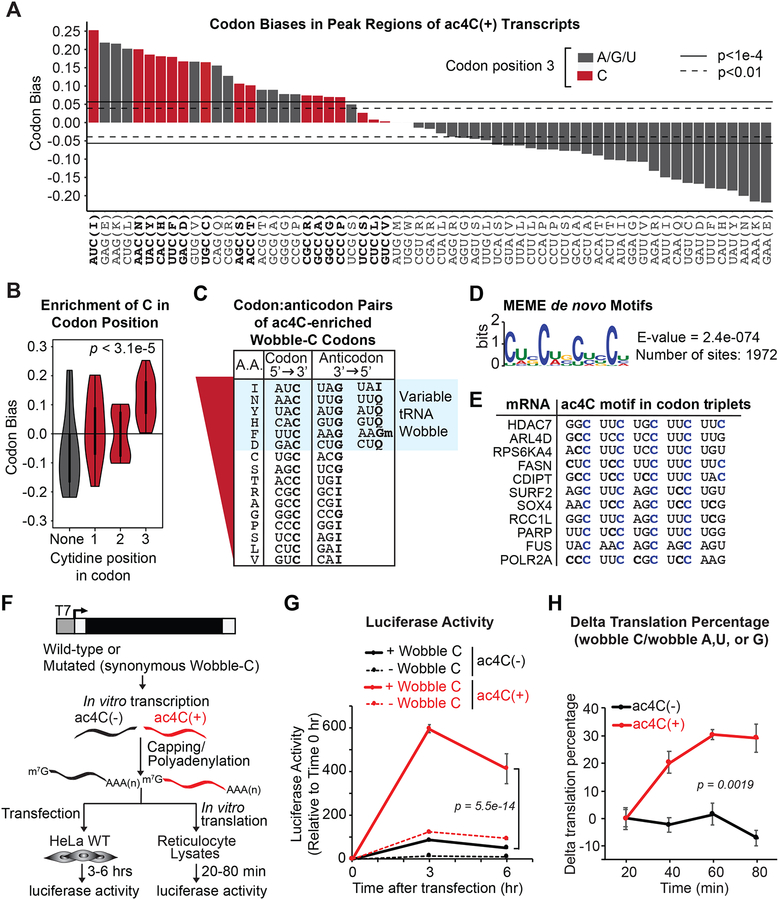
Figure 7. ac4C statistically and functionally associates with mRNA wobble cytidines.
(A) Codon bias within CDS-localized ac4C peaks relative to the entire transcriptome. Red bars depict codons with C in the wobble position. Horizontal lines indicate the magnitude of codon bias expected by random sampling at the significance level of p = 0.01 or p = 1e-4, as indicated.
(B) Violin plot of aggregated codon bias results from (A).
(C) ac4C-peak enriched codons with wobble C were ranked according to (A). Anticodon sequences of the respective tRNAs are shown with variable decoders highlighted in blue.
(D) Sequence logo of enriched motifs within ac4C peaks determined using MEME. Enrichment p-value (E-value) derived from FDR corrected Fisher’s Exact Test.
(E) Alignment of top scoring motifs in ac4C peaks to substrate mRNAs. Cytidines in blue designate occurrence within the third (wobble) position of each codon.
(F) Firefly luciferase mRNA naturally containing C within wobble sites (wobble C) or with synonymous codon substitutions that removed C from all wobble sites (wobble A, U or G) was generated in the presence of CTP or ac4CTP.
(G) mRNAs from (F) were transfected into HeLa cells. Luciferase activity was monitored through luminescence. Mean ± SEM, n=3. Two-Way ANOVA with Tukey’s post hoc test.
(H) mRNAs from (F) were in vitro translated in reticulocyte lysates. Data represent the % difference in luminescence of wildtype versus mutated luciferase in the presence or absence of ac4C, mean ± SEM, n=3. Two-Way ANOVA.

