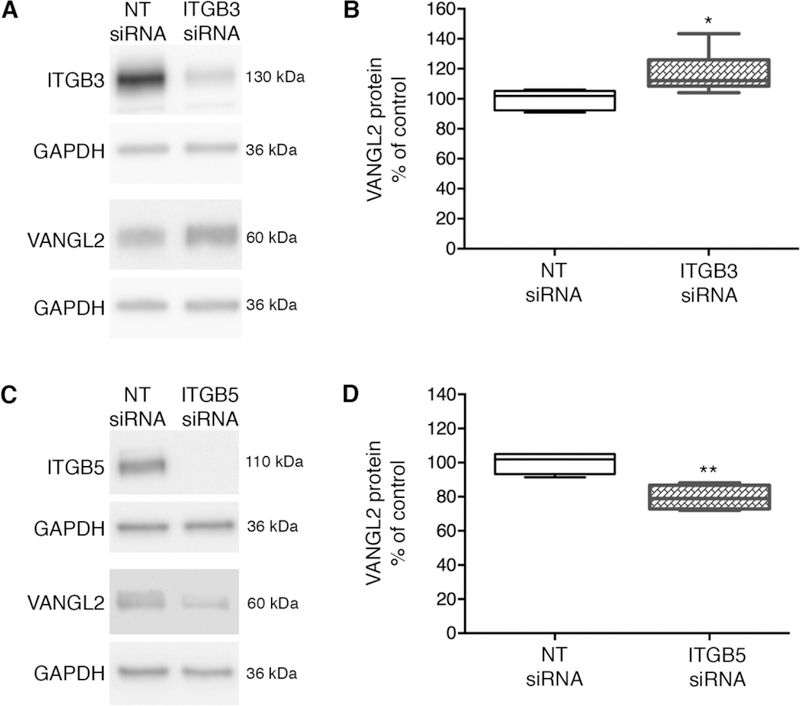
Fig. 4.

Opposing effects of integrin β3 and integrin β5 knockdown on VANGL2 protein levels.(A) Western blots of total protein from non-targeting (NT) control and integrin β3 (ITGB3) knockdown HT-1080 cells. Integrin β3 protein is reduced by 89%. (B) Box plot shows median value ± standard deviation (whiskers) and the interquartile range (boxes) of likely variation. Integrin β3 knockdown cells have increased VANGL2 protein levels (experiment performed three times, n = 9 biological replicates). (C) Western blots of total protein from NT control and integrin β5 knockdown cells. Integrin β5 protein is reduced by 100%. (D) Box plot showing integrin β5 knockdown cells have decreased VANGL2 protein levels (experiment performed three times, n = 8 biological replicates). *P < 0.05; **P < 0.01; P values are versus NT siRNA; two-tailed unpaired t-test.
