Fig. 7.

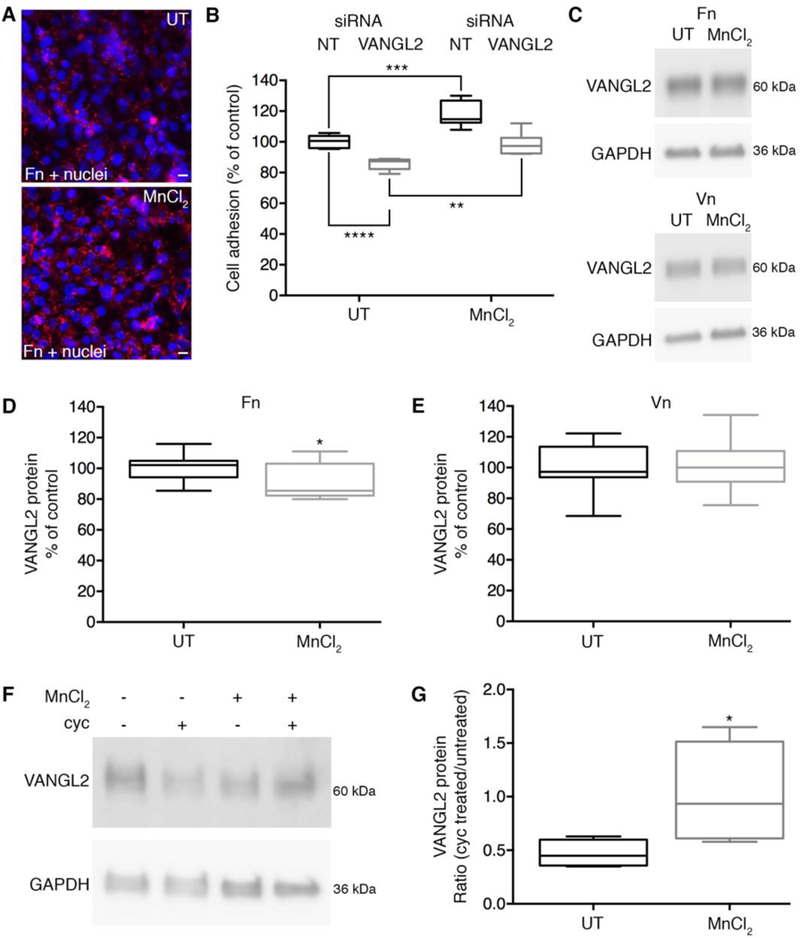
Integrin activation stabilizes VANGL2 protein levels. (A) Fibronectin (Fn) immunolabeling of HT-1080 cells untreated (UT) or treated with MnCl2 to stimulate integrin activation and fibronectin assembly. Nuclei are labeled with DAPI (blue). Scale bars = 20 μm.(B) Box plot of cell adhesion assay data showing effect of MnCl2 treatment on non-targeting (NT) control and VANGL2 siRNA transfected cells (experiment performed three times, n = 6 biological replicates). The median value ± standard deviation (whiskers) and the interquartile range (boxes) are shown. (C) Western blots of VANGL2 expression in untreated and MnCl2 treated cells plated on fibronectin and vitronectin. (D,E) Box plots showing VANGL2 protein levels are not increased in MnCl2 treated cells (experiments performed three times, n = 12 biological replicates). (F) Western blot of VANGL2 expression in cells that were untreated or treated with MnCl2 and/or cycloheximide (cyc). (G) Box plot showing the ratio of VANGL2 protein in cycloheximide treated/untreated cells with and without MnCl2 (experiment performed 6 times, n = 6 biological replicates). *P < 0.05; **P < 0.01; ***P < 0.001; ****P < 0.0001; P values are as indicated in panel B and versus VANGL2 expression in untreated cells in panels D and G; two-tailed unpaired t-test.
