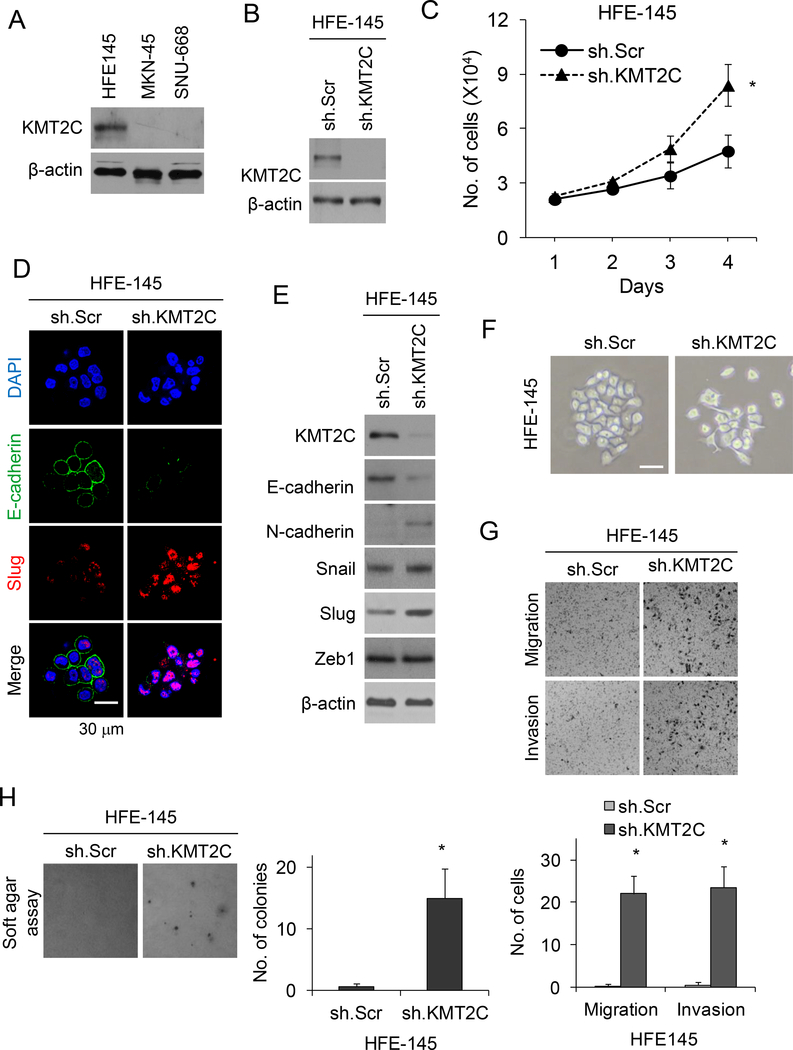
Figure 3. KMT2C loss results in epithelial-to-mesenchymal transition in HFE-145 cells.
(A) Western blot analysis of HFE-145, MKN-45, and SNU-668 cells for KMT2C. (B) Western blot for KMT2C in HFE-145 cells transduced with KMT2C shRNA (sh.KMT2C) or scrambled control shRNA (sh.Scr). (C) Graph showing proliferation over 4 days of HFE-145 cells transduced with sh.KMT2C or sh.Scr. (D) Confocal photos following immunofluorescent staining HFE-145 cells for DAPI, E-cadherin, and Slug. HFE-145 cells were transduced with KMT2C shRNA (sh.KMT2C) or scrambled control shRNA (sh.Scr). Scale bar, 30 μm. (E) Western blot demonstrating levels of KMT2C, E-cadherin, N-cadherin, Slug, Snail, and Zeb1 in HFE-145 cells transduced with sh.KMT2C or sh.Scr. (F) Photo of HFE-145 in tissue culture following transduction with sh.KMT2C or sh.Scr. Scale bar 20 μm. Photos and graphs of migration and invasion assays (G) and soft agar assay (H) for HFE-145 cells transduced with sh.KMT2C or sh.Scr. Bars represent standard deviation. *p<0.05 compared to control.

