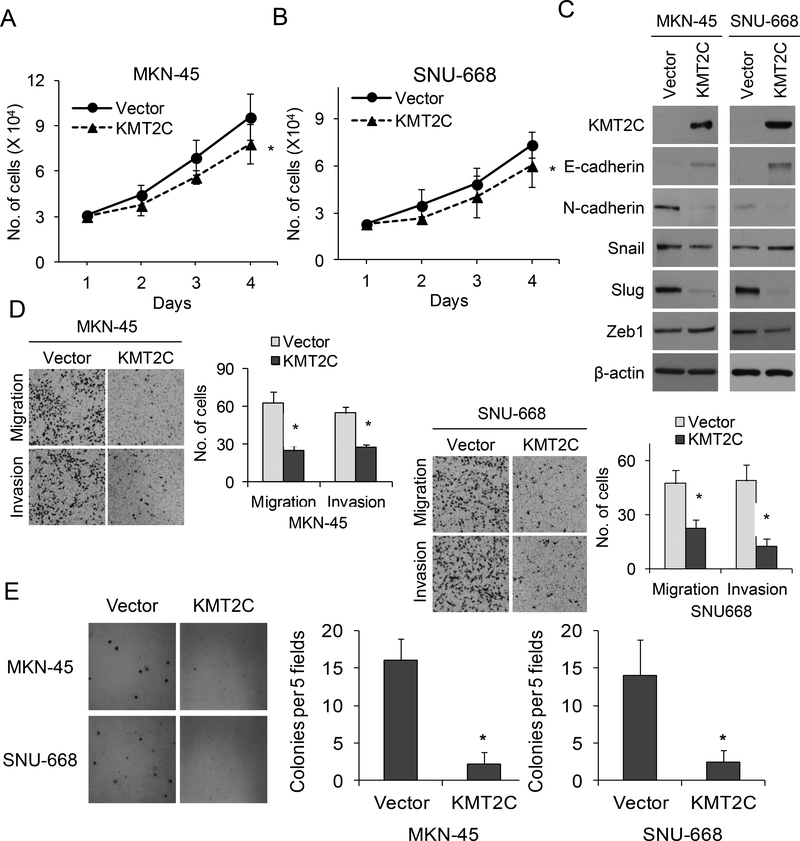
Figure 4. KMT2C expression reverses epithelial-to-mesenchymal transition in gastric adenocarcinoma cells.
Graphs showing proliferation over 4 days of MKN-45 cells (A) and SNU-668 cells (B) transduced with a KMT2C expression vector (KMT2C) or control vector (Vector). (C) Western blot demonstrating levels of KMT2C, E-cadherin, N-cadherin, Slug, Snail, and Zeb1 in MKN-45 and SNU-668 cells transduced with a KMT2C expression vector (KMT2C) or control vector (Vector). (D) Photos and graphs of migration and invasion assays for MKN-45 and SNU-668 cells transduced with a KMT2C expression vector or control vector. (E) Photos and graph of soft agar assay of MKN-45 and SNU-668 cells transduced with a KMT2C expression vector or control vector. Bars represent standard deviation. *p<0.05 compared to control.

