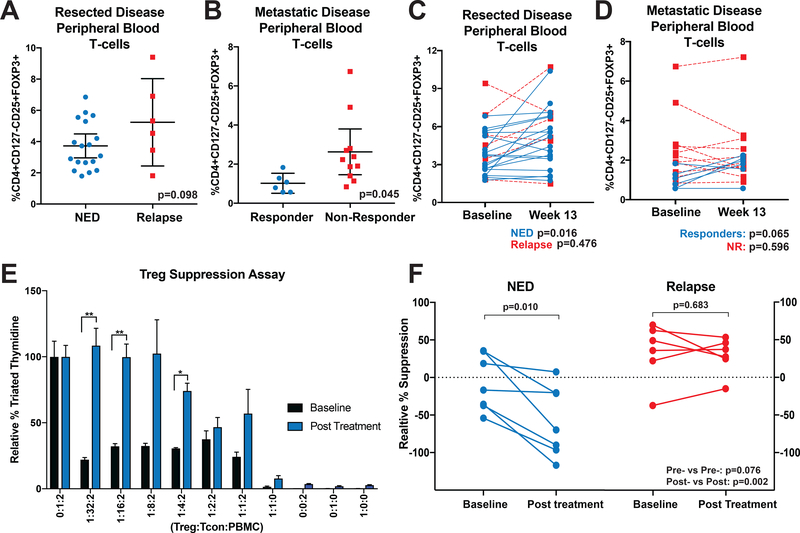
Figure 1. Nivolumab Therapy Reduces CD4+CD127low/−CD25+ T-cell Suppressive Function in Non-Relapsing Patients.
(A) Patient baseline PBMC samples were assessed by flow cytometry for Tregs (CD4+CD127-/lowCD25+FOXP3+) as a percentage of total CD3+ T-cells. (B) PBMC samples from patients with active disease treated with nivolumab were assessed as in (A). Error bars show mean with 95% confidence intervals. (C-D) Post-treatment samples from (C) resected disease patients and (D) active disease patients were likewise assessed. Paired patient samples are plotted with connecting lines. NED or responding patients are represented with blue lines and relapsing or non-responding patients with red, dotted lines. (E) Baseline (black bars) and after 13 weeks of nivolumab therapy (blue bars) patient PBMC CD4+CD127low/−CD25+ T-cells were isolated and co-cultured with allogeneic CD8+ T-cells and irradiated PBMC at indicated ratios. After 5 days, tritiated thymidine was added to cultures for a further 18 hours and cultures assessed for radioactive incorporation. Suppression was normalized against control cultures containing no CD4+CD127low/−CD25+ T-cells (100% proliferation). *p<0.05, **p<0.01. Error bars show standard error of the mean (SEM). (F) Additional patient CD4+CD127low/−CD25+ T-cells were likewise assessed for suppression at a 1:2:2 ratio. Patients are grouped based on outcome with intra-patient pre-treatment and post-treatment samples connected by solid lines. P-values are reported in graphs for paired analyses (above group plots) and for comparisons based on response (on bottom right of graph).

