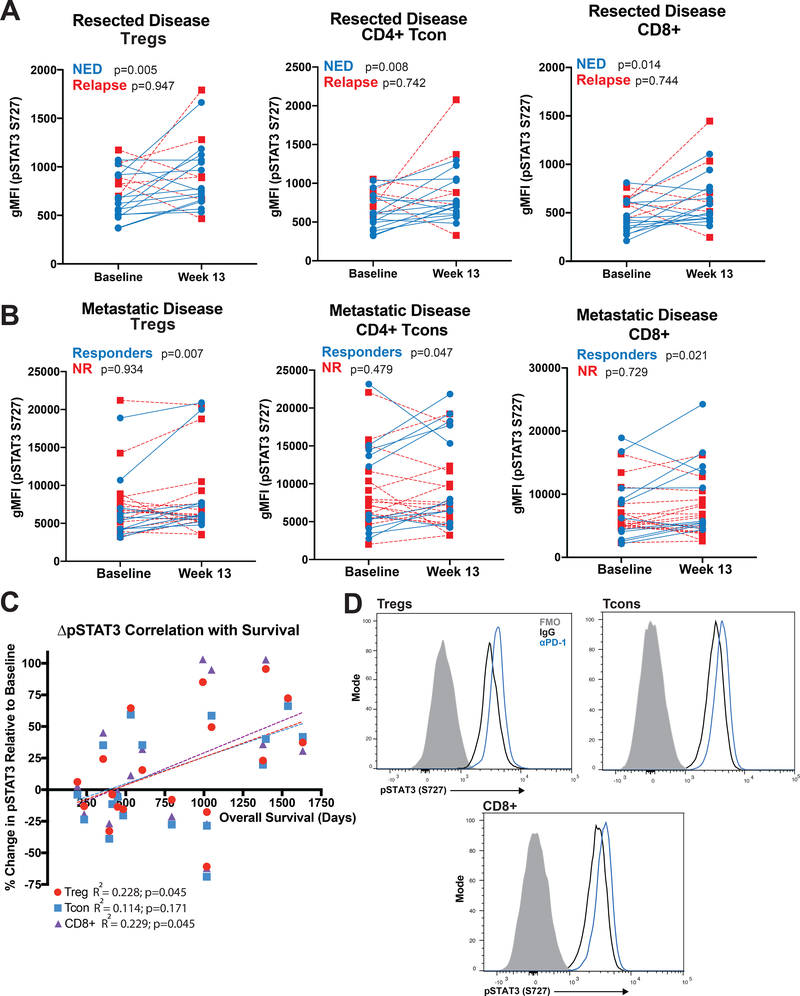
Figure 2. PD-1 Blockade Increases Expression of Phosphorylated STAT3 in T-cells.
(A) Paired PBMC samples (baseline and week 13 post-nivolumab treatment initiation) from patients treated with adjuvant nivolumab were assessed by flow cytometry and the geometric mean fluorescent intensity (gMFI) of pSTAT3 S727 determined in Tregs (CD4+CD127-/lowCD25+FOXP3+), CD4+ Tcons and CD8+ T-cells. Blue lines connect paired NED patient samples and red, dotted lines connect relapsed patient samples. (B) PBMC samples from active metastatic disease patients treated with nivolumab were likewise assessed. (C) Changes in pSTAT3 intensity of PBMC Tregs (red circles), CD4+ Tcons (blue squares) and CD8+ T-cells (purple triangles) in metastatic disease patients are plotted in relation to overall patient survival. (D) CD3+ T-cells were isolated from baseline patient PBMC and cultured for 48 hours in the presence of IgG (black line histogram) or PD-1 blocking antibodies (blue line histogram), then assessed by flow cytometry for expression of pSTAT3 S727 in CD4+CD127-/lowCD25+ Tregs, CD4+ Tcons and CD8+ T-cells. Fluorescence minus one (FMO) histograms are shown in solid gray.

