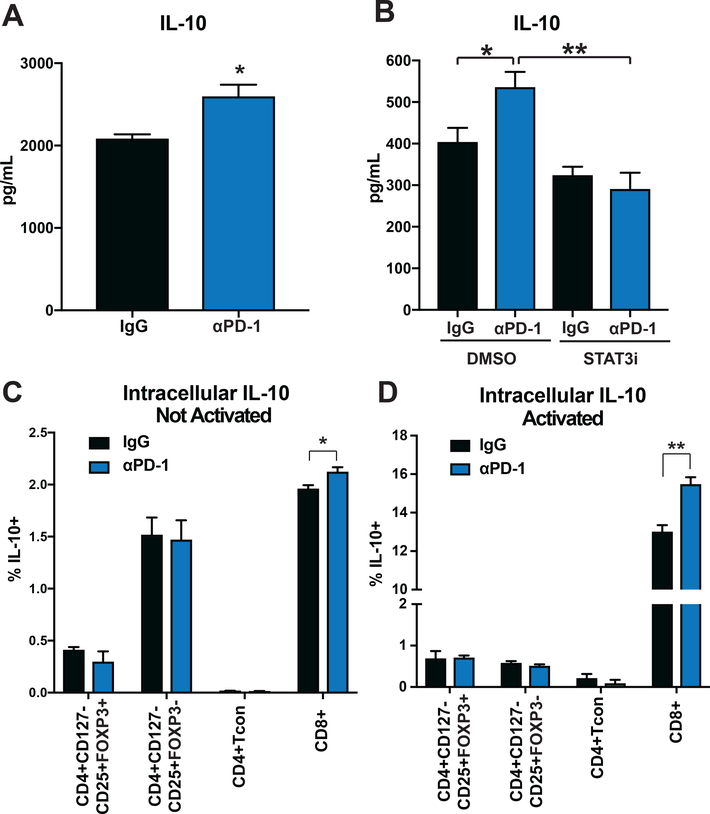
Figure 3. PD-1 Blockade Increases Expression of IL-10.
(A) CD3+ T-cells were isolated by negative magnetic separation from baseline patient PBMC, cultured for two hours with IgG or αPD-1 (5ug/mL) and then activated with CD3/CD28 Dynabeads for 72 hours. Supernatant IL-10 levels were assessed in a Luminex assay. (B) T-cells were treated with IgG or αPD-1 (5ug/mL), and stattic (200nM) or DMSO control. IL-10 production was assessed by Luminex. (C-D) Isolated CD3+ T-cells were evaluated by intracellular flow cytometry for IL-10 expression after treatment with IgG or αPD-1 (5ug/mL) (C) without or (D) with the addition of CD3/CD28 Dynabeads. Indicated cell populations were gated on and percentage of IL-10 positive cells determined. All bar graphs illustrate means +/− SEM for triplicates/group. *p<0.05, **p<0.01, ***p<0.001, ****p<0.0001.

