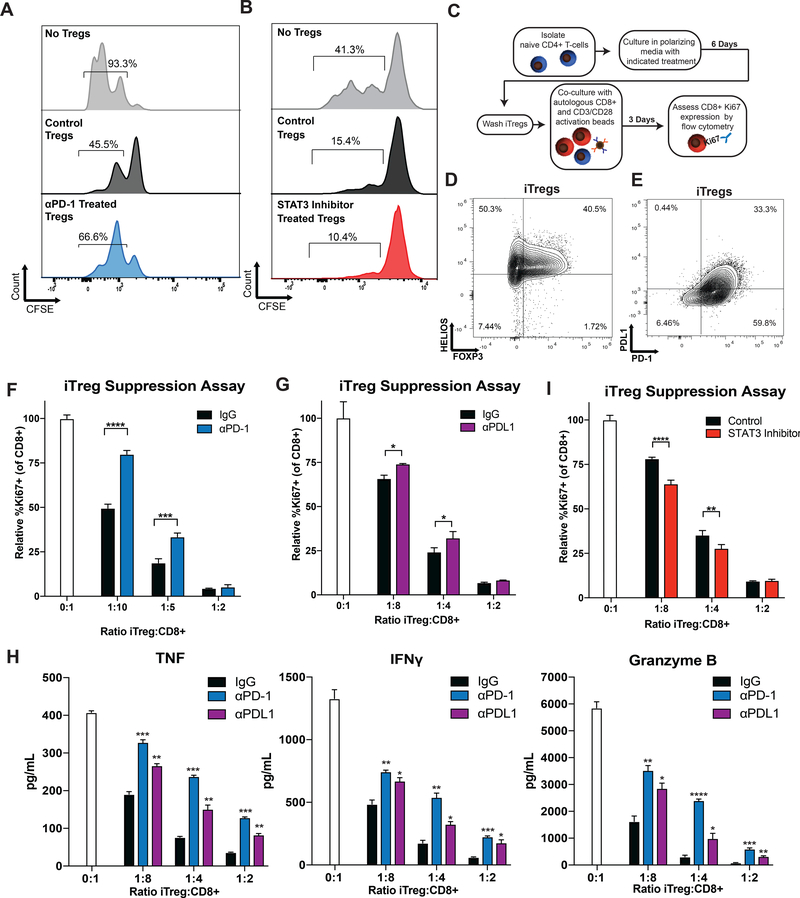
Figure 5. PD-1 and PDL1 Blockade Reduces While STAT3 Inhibition Enhances iTreg Suppressive Function.
(A-B) Human nTregs were treated with αPD-1 (5ug/ml), stattic (200nM), DMSO, or IgG and expanded with CD3/CD28 Dynabeads (1:1) for 3 days, then washed. nTreg suppression was evaluated in cultures with CFSE-loaded autologous T cells (1:30, nTreg:T-cell), stimulated by CD3/CD28 Dynabeads (1:30). (A) Histograms showing proliferation peaks (by CFSE dilution) for cultures with no Tregs (grey histogram), IgG pre-treated Tregs (black histograms) and αPD-1 pre-treated Tregs (blue histograms) are shown. (B) Histograms showing proliferation peaks for cultures with no Tregs (grey histogram), DMSO pre-treated Tregs (black histograms) and stattic pre-treated Tregs (red histograms) are illustrated. The percentages of cells with ≥1 division are given above each corresponding histogram. One representative of two independent experiments is shown for each. (C) Naïve CD4+ T-cells were cultured in iTreg polarizing conditions with the addition of specified treatments. T-cells were washed and cultured with autologous CD8+ T-cells at indicated ratios with the addition of CD3/CD28 Dynabeads. (D) Polarized CD4+ T-cells were assessed by flow cytometry for expression of FOXP3 (x-axis) and HELIOS (y-axis). (E) Polarized cells were also assessed for PD-1 (x-axis) and PDL1 (y-axis) expression. (F) Ki67 expression by CD8+ T-cells cultured with iTregs was assessed by flow cytometry and graphed relative to cultures containing only CD8+ T-cells (white bars). IgG controls are illustrated in black and αPD-1 pre-treated iTregs illustrated in blue. Results shown are representative of six samples assessed in six independent experiments. (G) The suppressive function of IgG (black bars) and PDL1 blocking antibody (purple bars) pre-treated iTregs were likewise assessed. Results shown are representative of three samples assessed over two independent experiments. (H) TNF (left panel), IFNγ (middle panel), and Granzyme B (right panel) cytokine production from iTreg suppression assays was assessed. Results shown are representative of three samples from three independent experiments. (I) An iTreg polarization experiment was performed with stattic (red bars) or control (black bars) pre-treatment, and CD8+ Ki67 expression assessed. Results shown are representative of five samples assessed over three independent experiments. Error bars are +SEM for triplicate samples assessed. **p<0.01, ***p<0.001, ****p<0.0001, ****p<0.00001.

