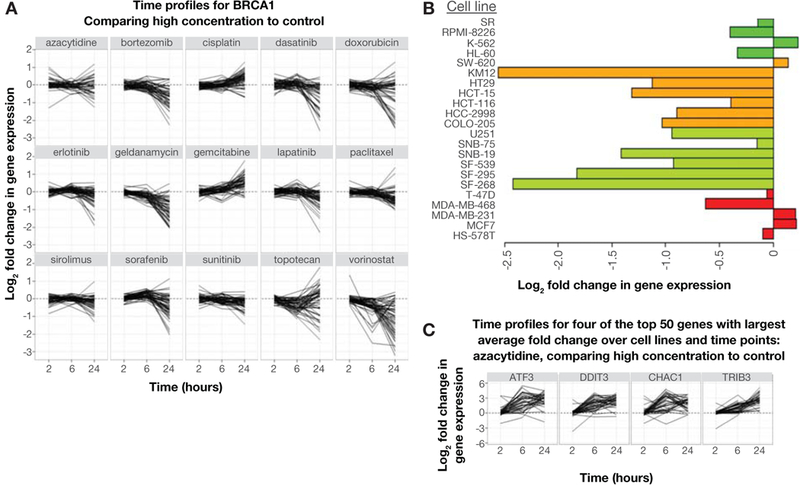
Figure 1.

NCI TPW users can download graphs and heatmaps demonstrating changes in the expression levels of 12,704 genes in the NCI-60 panel of cell lines exposed to two different concentrations of 15 anticancer agents. A: single-gene response to all 15 agents at two different concentrations over three time points (shown, BRCA1 against all drugs tested at the high concentration); B: single-gene response (log2 fold expression change) following treatment with selected agent, by cell line (shown, LIF expression following 6 hours of exposure to high-concentration geldanamycin in breast [red], CNS [light green], colon [orange], and leukemia [dark green] cancer cell lines); C: genes most highly modulated by selected treatment parameter (shown, high-concentration azacytidine).
