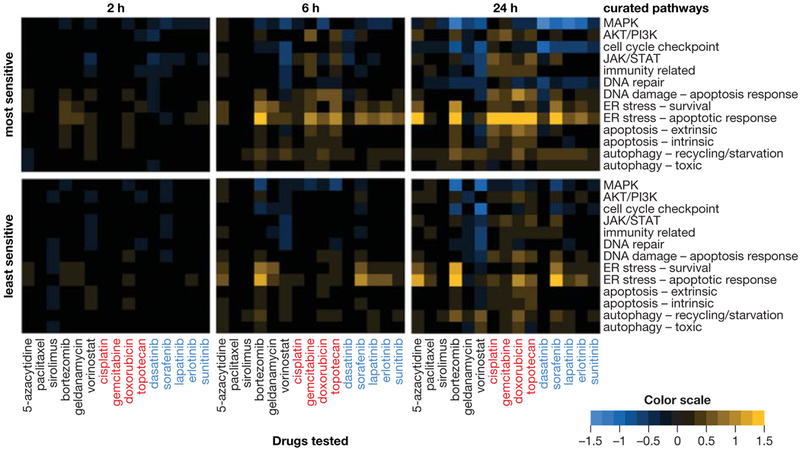
Figure 3.

Cell signaling pathway–specific gene expression responses associated with drug sensitivity and insensitivity across the NCI-60 cell line panel. Average responses of the 10 most sensitive (top) or 10 least sensitive (bottom) cell lines after 2, 6, or 24 hours of treatment with the highest concentration of each drug, arranged by drug mechanism of action: kinase inhibitors (labeled in blue), genotoxic agents (red), or agents of other mechanistic classes (black). Pathway upregulation and downregulation are indicated by yellow and blue, respectively. Transcriptionally regulated, pathway-specific genes used to identify pathway modulation are provided in Supplementary Table S2.
