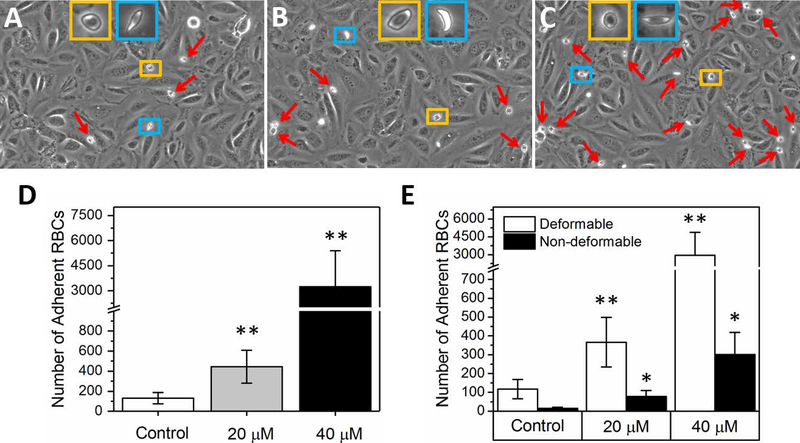
Figure 3. Sickle RBC adhesion to heme-activated ECs in vitro.
Representative adherent RBC images to non-activated (A), 20 μM (B) and 40 μM heme-activated (C) ECs are illustrated. (D) Overall, sickle-RBC adhesion is low to quiescent ECs (Control group, N=15) and increases with heme activation depending on the concentration (N=16). (E) Both deformable and non-deformable HbS RBC sub-populations exhibit an adhesive response while adhesion of deformable RBCs was significantly greater in each condition. In (A), (B), and (C), deformable RBCs are shown in yellow rectangles while the non-deformable cells, which may be irreversibly sickled, are demonstrated in blue rectangles. Red arrows indicate adherent RBCs. P values in (D) and (E) computed based on the Mann-Whitney test and the stars at the top of the bars indicate statistically significant difference (one star: p<0.05 and two stars: p<0.01).

