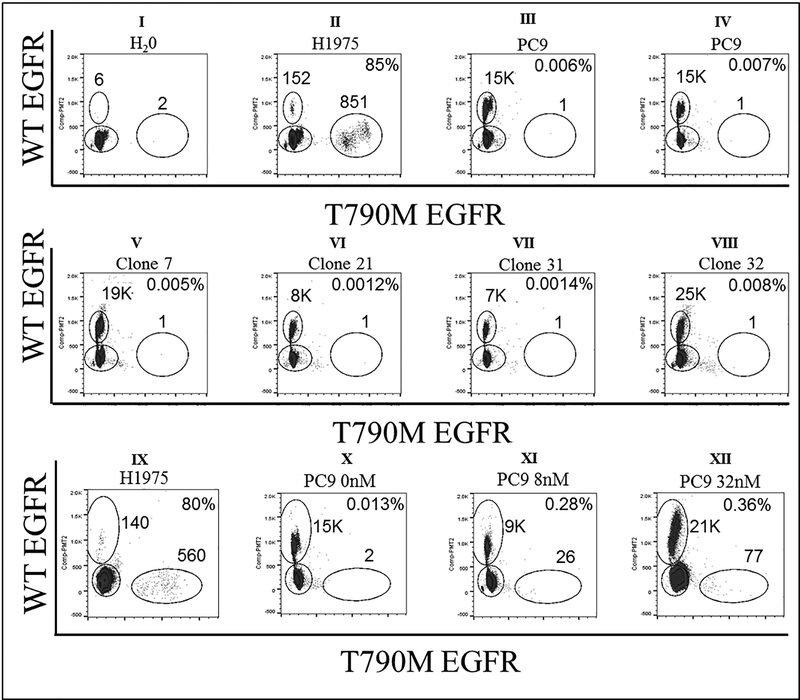
Figure 1. EGFR mutation status by ddPCR.
Detection of WT EGFR (y-axis) and EGFR T790M mutation (x-axis). Panel I shows six WT EGFR and two T790M EGFR events in H2O (negative control) representing ddPCR assay background. Panel II shows 85% T790M mutation rate in H1975 cell line (positive control). Panels III and IV show baseline/background T790M mutations in parental PC9 cell line. Single cell PC9 clones show similar baseline/background T790M mutations as parental PC9 cell line (panels V, VI, VII, and VIII). PC9 cell line was treated with serially increasing gefitinib dose. Panel IX shows high T790M mutation rate in positive control, H1975 cell line. Panel X shows low T790M mutation rate in untreated PC9 cell line as compared to Panel XI, XII high mutation frequency after exposure to gefitinib at 8nM, 32nM, respectively.

