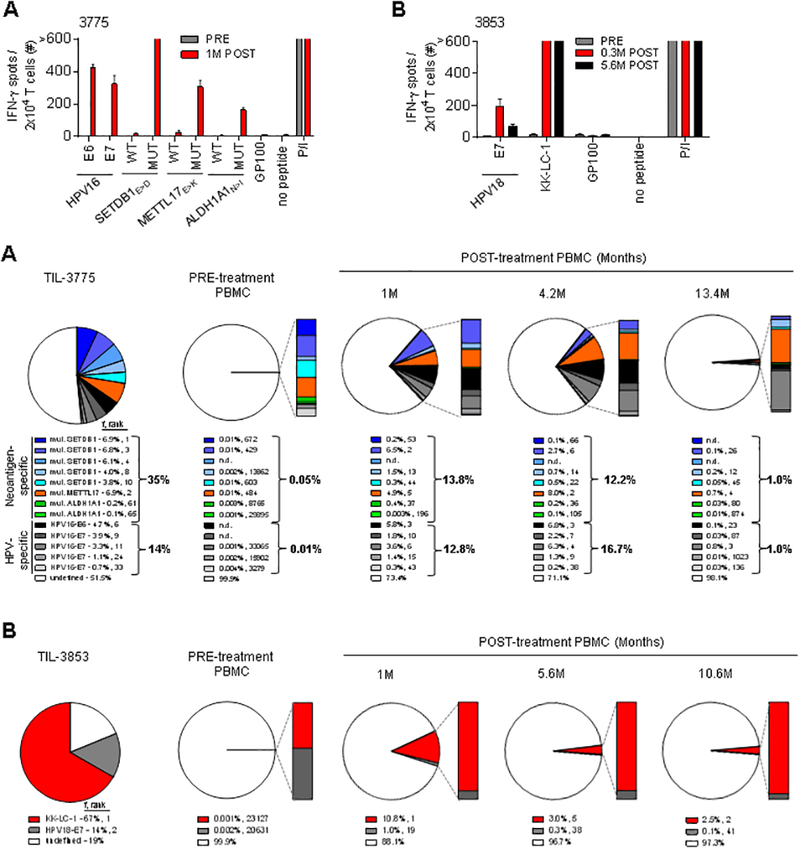
Fig. 3. Repopulation of peripheral blood (PB) by infused T cells targeting viral and non-viral tumor antigens throughout cancer regression and remission.

(A and B) Reactivity of PB T cells from before (PRE) and after (POST) treatment was assessed by IFN-γ ELISPOT assay against peptides from tumor antigens identified in patient’s infused TIL. (A) Reactivity of PB T cells from patient 3775 from before and 1 month (M) after treatment to peptide pools of HPV16-E6, HPV16-E7 and GP100 (negative control), and mutated (MUT) and wild-type (WT) SETDB1E>D, METTL17E>K, and ALDH1A1N>I 25-mer peptides pulsed on autologous DCs. (B) Reactivity of PB T cells from patient 3853 from before, 0.3 and 5.6 M after treatment to peptide pools of HPV18-E7, KK-LC-1 and GP100 (negative control) pulsed on autologous DCs. T-cell reactivity was measured at 20–24 hours in co-culture assays. Error bars represent standard deviation of duplicate wells. “>” denotes off-scale values. P/I stimulation was used as a positive control in all co-culture experiment. (C and D) Frequency (f) and rank of individual tumor antigen-specific TCRB clonotypes as identified within (C) TIL-3775 and (D) TIL-3853 among PB mononuclear cells (PBMC) pre- and post-treatment (at the indicated months (M)), as determined by TCRB deep sequencing. Pie charts display the sum of the frequencies of individual TCRB clonotypes with indicated tumor antigen specificity in the infused TIL.
