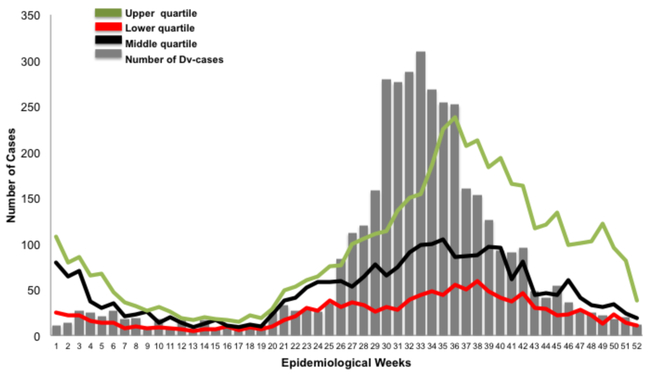
Figure 1. Endemic channel of Dengue cases during 2011 outbreak.
In grey bars, number of dengue cases per epidemiological week: lines show the endemic channel with green representing the upper quartile, red the lower quartile, black the middle quartile. Since epidemiological week 26, an increase of cases is shown; which is maintained for 11 weeks, with a sustained increase during epidemiological weeks 30 to 33. The endemic channel was constructed using 7 years of data, which included two Dengue epidemic years 2005 and 2009.

