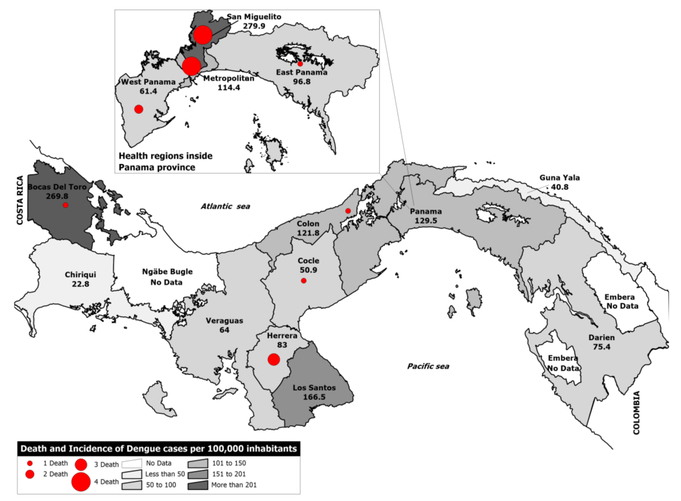
Figure 2. Map of dengue cases in Panama during 2011.
Map shows, using a grey color scale, the incidence of dengue cases with red dots corresponding to the number of fatal cases per province or indigenous reservation (Guna Yala, Embera, Ngäbe Bugle). No cases were reported from other indigenous reservations besides the Guna Yala.

