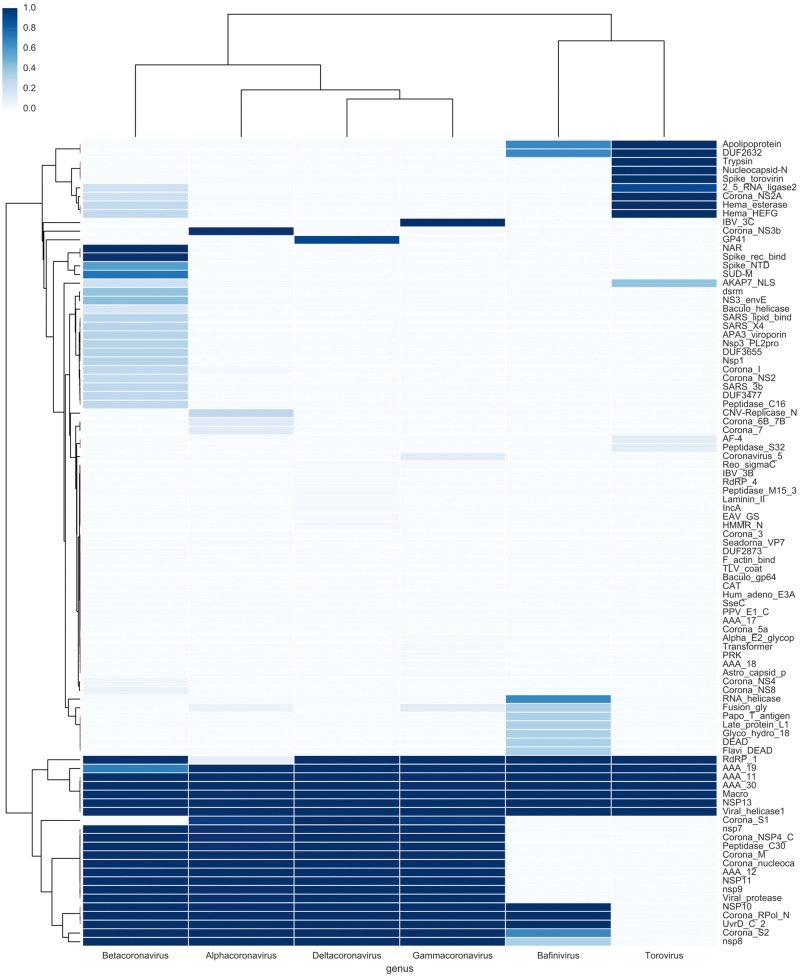
Figure 3.
Cluster map of Pfam protein domains encoded by Coronaviridae genomes. The protein domain repertoire, as detected by profile HMMs, is plotted as the frequency of each domain in all available full genomes from all Coronaviridae genera. Each row represents a protein domain, each column represents a Coronaviridae genus. Colors indicate domain frequency within that genus (darkest blue = 1 = all genomes in this genus encode this domain; white = 0 = no genomes in this genus encode this domain, see color bar at upper left).

