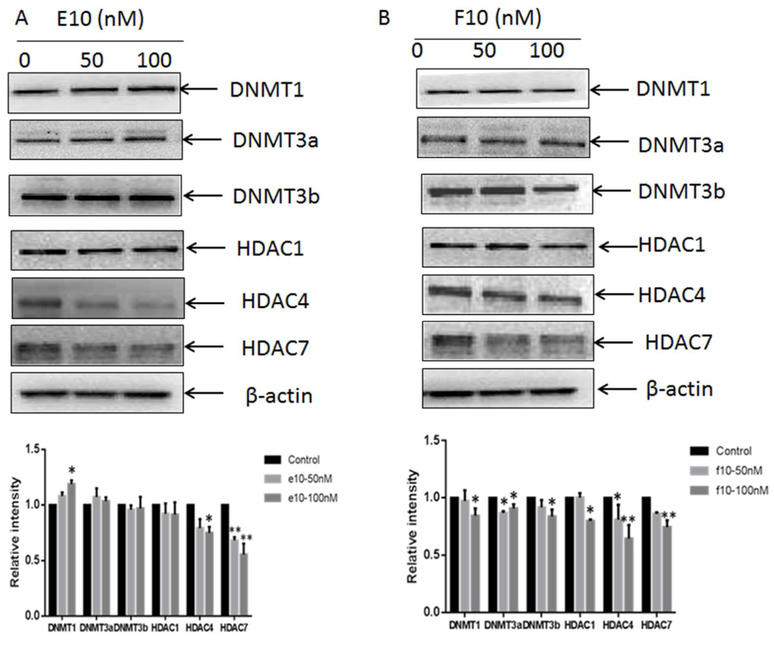
Figure 6.
Effects of E10 (Figure 6A) and F10 (Figure 6B) on DNMT and HDAC protein expression. TRAMP-C1 cells were subjected to three day treatments of E10 (0, 50 and 100 nM) and F10 (0, 50 and 100 nM). The relative expression of proteins was measured according to the intensity of the related bands normalized by β-actin. The results are represented as mean ± SD. *, p < 0.05 and **, p < 0.01 compared with the control.

