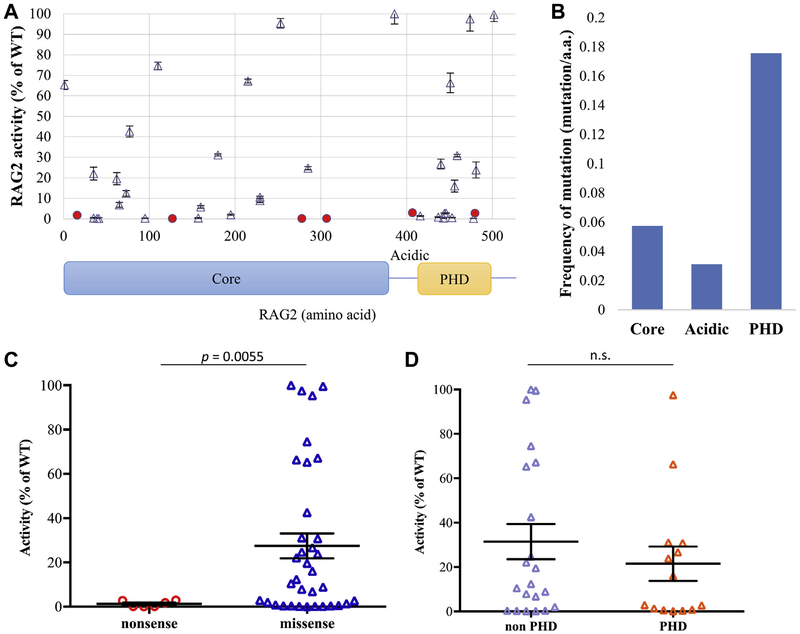
FIG 3.
Recombination activity of mutant RAG2 proteins. A, Graphic representation of the recombination activity of various RAG2 mutations according to their position in different domains of the RAG2 protein (core domain: amino acids 1–383; plant homology domain [PHD]: amino acids 414–487). Solid circles identify nonsense mutations, and triangles represent missense mutations. Means ± SEMs are shown to illustrate recombination activity. For each RAG2 variant, the assay was performed in triplicates. B, Frequency of pathogenic mutations (defined as recombination activity <80% WT-hRAG2) per amino acid length of various domains of the hRAG2 protein. C, Recombination activity (expressed as percentage of the activity of WT-hRAG2) of nonsense and missense hRAG2 mutations. Bars represent means ± SEMs. Statistical analysis was performed with the Mann-Whitney test. D, Recombination activity (expressed as percentage of the activity of WT-hRAG2) of missense mutations affecting the PHD and non-PHD domains of the hRAG2 protein. Bars represent means 6 SEMs. Statistical analysis was performed with the Mann-Whitney test. n.s., Not significant.

