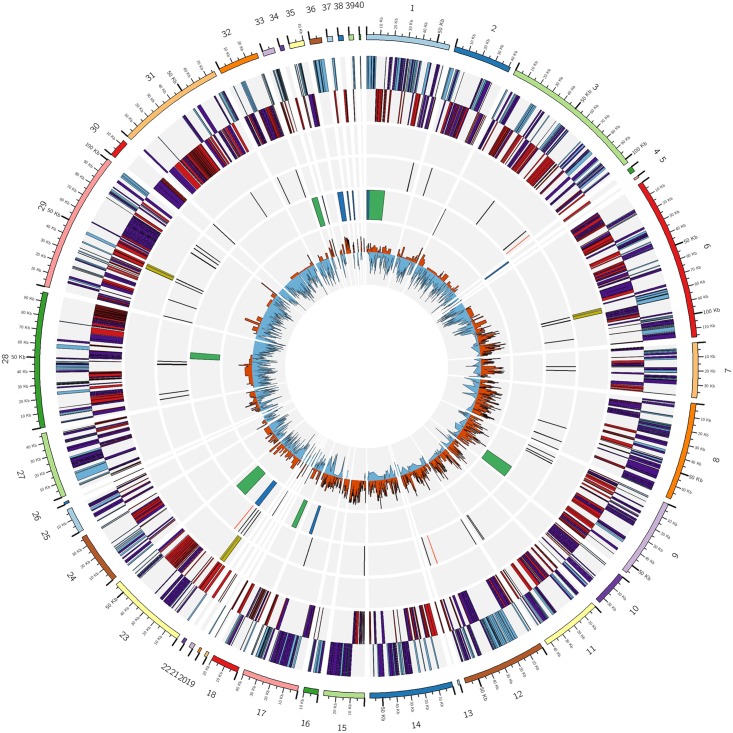
FIGURE 1.
Circular diagram of LsoD ISR100 genome. Descriptions of rings are from the outer to inner circle. (i) Contigs; (ii) protein coding genes in the positive (blue) and negative (red) strands. Enzymes in both strands are highlighted in purple; (iii) rRNA genes (yellow); (iv) tRNA (black lines) and other non-coding RNA (red lines); (v) prophage regions identified by PHASTER (green) and homologous (BLASTN) regions to Prophage P1 from LsoA (blue); and (vi) positive (orange) and negative (blue) GC-skew. Circular ideogram was plotted with CIRCOS (Krzywinski, 2009).

