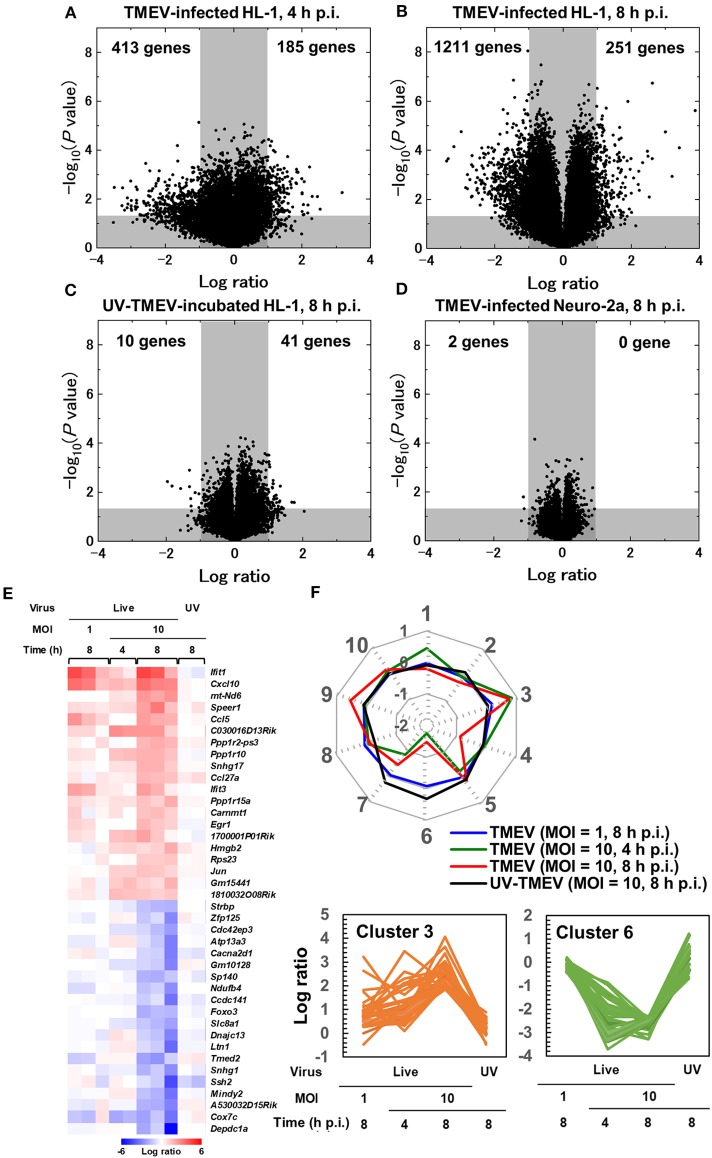
Figure 3.
Supervised bioinformatics analysis of transcriptome data from cardiomyocyte HL-1 cells infected with TMEV (33, 42). (A–D) Volcano plots of significantly up-regulated (upper right) or down-regulated genes (upper left) in TMEV-infected cells by the OriginPro 8.1 (OriginLab Corporation, Northampton, MA), to assess significance together with log ratio of transcriptome data (Supplementary Materials and Methods) (33). Log ratios of gene expression in the TMEV-infected cell culture compared with mock-infected cell culture were used as the x-axis and the logarithms of P values to base 10 were used as the y-axis. (A) TMEV-infected HL-1 cells at MOI = 10 at 4 h p.i. (B) TMEV-infected HL-1 cells at MOI = 10 at 8 h p.i. (C) HL-1 cells incubated with ultraviolet (UV)-irradiated TMEV for 8 h. (D) TMEV-infected Neuro-2a cells s at MOI = 10 at 8 h p.i. (E) Heat map of 20 up- or down-regulated genes in TMEV-infected HL-1 cells at MOI = 10 at 8 h p.i. by R version 3.4.3 and the R packages “gplots” and “genefilter.” Red, blue, and white indicate up-regulation, down-regulation, and no change, respectively. Interferon-inducible genes (Ifit1 and Ifit3) and chemokines (Cxcl10 and Ccl5) were significantly up-regulated. While TMEV-infected HL-1 cells at MOI = 10 for 4 h or at MOI = 1 for 8 h showed a similar expression pattern in several genes, HL-1 cells incubated with UV-TMEV for 8 h did not up- or downregulated these genes. (F) Radar chart based on the values of cluster centers from k-means clustering. The number at each vertex is the cluster number (clusters 1 to 10), whereas the numbers along the axis (−2 to 1) are log ratios compared with mock-infected controls. Up-regulated genes in TMEV-infected HL-1 cells 4 and 8 h p.i., including Cxcl10 and Ifit1, were categorized mostly in cluster 3, while the downregulated genes only 8 h p.i. or 4 and 8 h p.i. were categorized in cluster 4 or 6, respectively. In UV-TMEV-incubated HL-1 cells, most genes showed no change; the values of most cluster centers were log ratios = 0. List of genes in each cluster was shown in Supplementary Table 3.

