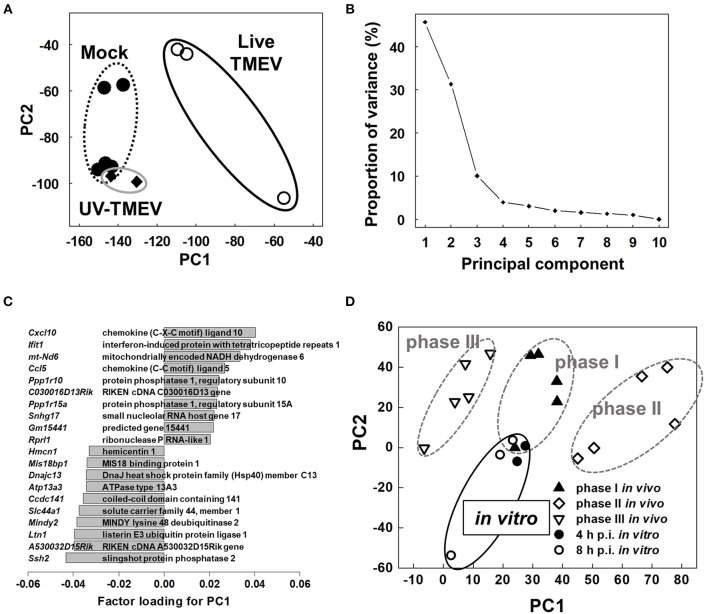
Figure 4.
Unsupervised principal component analysis (PCA) of transcriptome data of mock-infected, TMEV-infected, and UV-TMEV-incubated HL-1 cells (33, 42). (A) PCA separated samples into two groups: TMEV-infected samples vs. uninfected samples (mock infection and UV-TMEV), where principal component (PC) 1 reflected live virus infection. (B) The proportion of variance showed that PC1 explained 46% of the variance among the samples. (C) Factor loading for PC1 showed that chemokines (Cxcl10 and Ccl5) and interferon-inducible genes (Ifit1) were correlated with PC1 positively, while several genes including slingshot protein phosphatase 2 (Ssh2) and listerin E3 ubiquitin protein ligase 1 (Ltn1) were correlated with PC1 negatively. (D) PCA of transcriptome data of TMEV-infected HL-1 cells 4 and 8 h p.i. and heart samples from phases I (4 days p.i.), II (7 days p.i.), and III (60 days p.i.) in TMEV-induced myocarditis in vivo. PCA showed that phase I samples and in vitro samples had similar PC1 values, compared with phases II and III samples. PCA was conducted using R version 3.4.3 (13). Microarray data were converted into tab-delimited text format and calculated using an R program “prcomp”.

