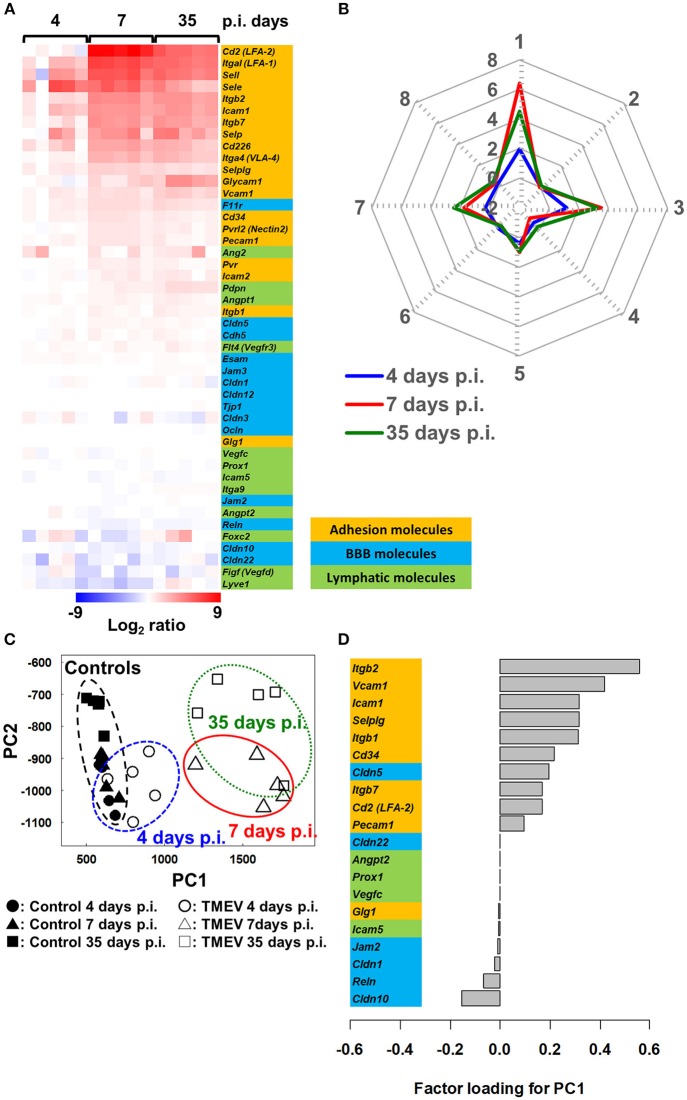
Figure 6.
Bioinformatics analyses of gene expression of three components associated with spinal cord inflammation in TMEV infection, 4 (prior to cell infiltration), 7 (acute polioencephalomyelitis) and 35 (TMEV-IDD) days p.i. (61). (A) We drew a heat map, using mRNA data of 20 adhesion molecules, 14 BBB molecules, and 12 lymphatic molecules listed in Figure 5 (total 46 genes). Most adhesion molecule genes were upregulated 7 and 35 days p.i., while only a few adhesion molecules were upregulated 4 days p.i. BBB and lymphatic molecules showed no change or slight downregulation. (B) Radar chart based on the values of cluster centers from k-means clustering (Supplementary Table 4). The number of each vertex is the cluster number (clusters 1 to 8), whereas the number along the axis (−2 to 8) are log ratios compared with mock-infected controls. Radar chart showed that the expression patterns of sets of genes were similar between days 7 and 35 p.i. Upregulated genes were categorized mostly in clusters 1, 3, and 7. (C) PCA of the 46 genes listed in Figure 5 separated controls/day 4 p.i. samples vs. days 7 and 35 p.i. samples based on PC1 values (proportion of variance was 85.9%), which reflect CNS cell infiltration. (D) Factor loading for PC1 showed that upregulation of adhesion molecules was associated with CNS inflammation, while downregulation of BBB and lymphatic molecules may play a minor role.

