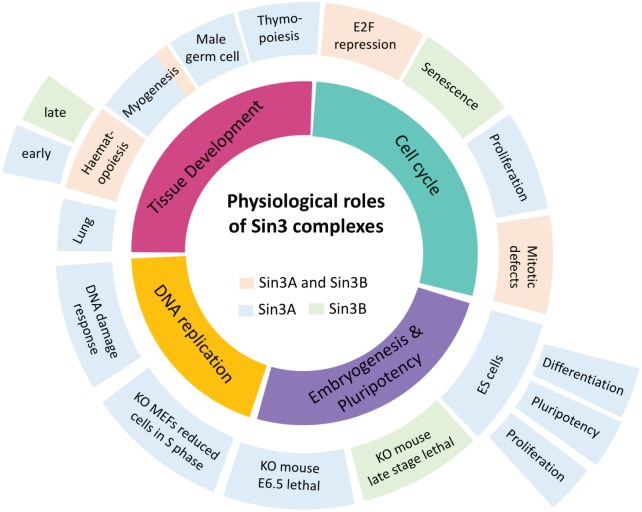
Figure 2. Representation of the physiological roles of Sin3 complexes in mammalian cells and tissue development.
Inner ring represents the cellular process, with the outer rings denoting the specific complex functions. Processes in which Sin3A (blue), Sin3B (green) or both (orange) have been implicated are indicated.

