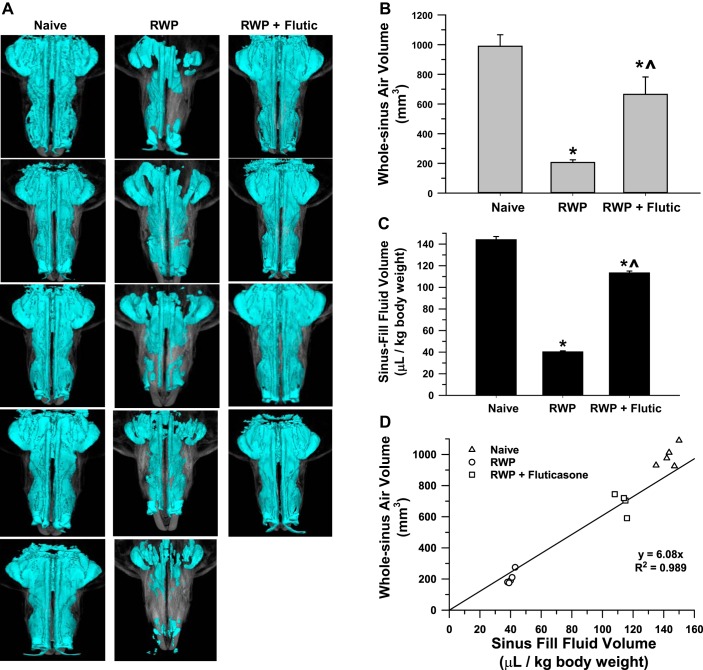
Fig. 7.
A: pictures of 3-dimensional whole sinus images of guinea pigs from naïve (n = 5), ragweed pollen (RWP)-challenged (n = 5), and RWP + fluticasone (Flutic; 100 µg; n = 4) groups. B: whole sinus air volume as measured by microcomputed tomography (micro-CT) in the same groups as indicated in A. Statistical significance is indicated as *P < 0.05 compared with naïve and ^P < 0.05, RWP + Flutic compared with RWP alone. C: sinus fluid-fill volume (SFFV) measurements in the same treatment groups as pictured in A; significance symbols as in B. D: association of sinus volume measured with the SFFV method and the whole sinus air volume measured by micro-CT for guinea pigs in A–C with linear regression equation (y = 6.08x) and correlation coefficient (r2 = 0.989) as shown; regression was constrained to pass through the origin of the plot; standard error and lower and upper confidence limits of slope were 0.38, 4.89, and 7.27, respectively.

