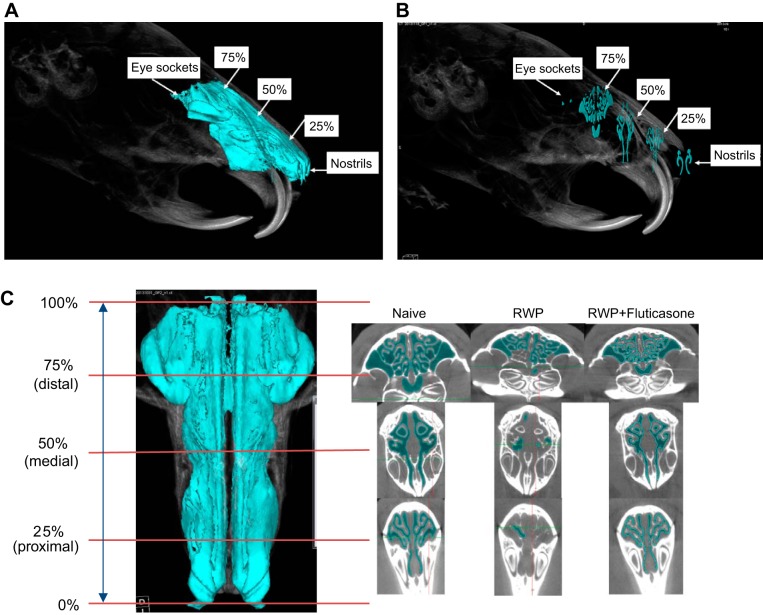
Fig. 8.
A: oblique-angle view of 3-dimensional (3-D) naïve guinea pig full-sinus image indicating anatomic and sinus-length landmarks used for microcomputed tomography (micro-CT) image slice analysis, with air-space volume indicated by blue coloration. Nostrils and eye sockets provided the proximal and distal whole sinus-length boundaries, from which the 25, 50, and 75% sinus-length landmarks were derived. B: same oblique-angle view as indicated in A, with micro-CT images of single slices obtained at 25, 50, and 75% sinus-length intervals and with nostril and eye socket slice images at sinus-length extremes for reference. C, left: 2-dimensional picture of the same naïve guinea pig full-sinus image with air-space volume as in Fig. 7, viewed axially (looking down directly on top of the head), to show the full length, and right-angle-to-longitudinal-axis register of the 25, 50, and 75% sinus-length slice landmarks, demarcating the proximal, medial, and distal sinus regions. Right: composite of micro-CT slices taken from 3-D full-sinus image at each length landmark for representative single guinea pigs from the naïve, ragweed pollen (RWP), and RWP + fluticasone treatment groups in which dark blue coloration was used to indicate air spaces within the respective slices at each level. Note 1) the similarity of sinus image topography across sinus landmark levels and guinea pigs in each group and 2) the relative lack of dark blue coloration within the image slices of the RWP examples, indicating reduced air-space volume and increased sinus congestion, compared with the naïve and RWP + fluticasone treatment examples.

