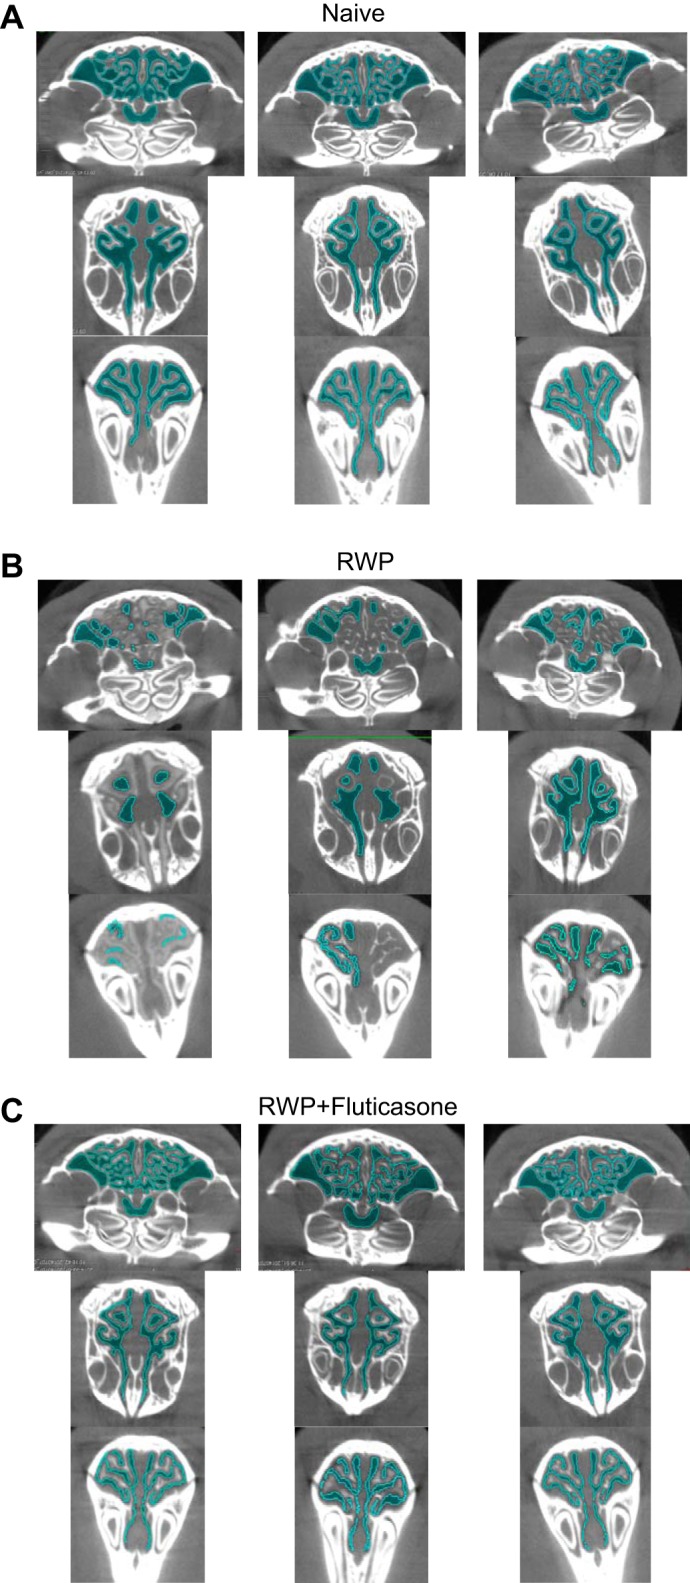
Fig. 9.

Three sets of microcomputed tomography (micro-CT) image slices taken from three whole sinus three-dimensional micro-CT images of guinea pigs from naïve group (A), ragweed pollen (RWP) group (B), and RWP + fluticasone group (C) to indicate assessment and comparison of sinus air-space area (darker blue coloration) and sinus perimeter (lighter blue coloration) demarcation. Images from the RWP-treated guinea pigs consistently demonstrated a decrease in both the darker and lighter blue coloration compared with those in the naïve and RWP + fluticasone treatment examples.
