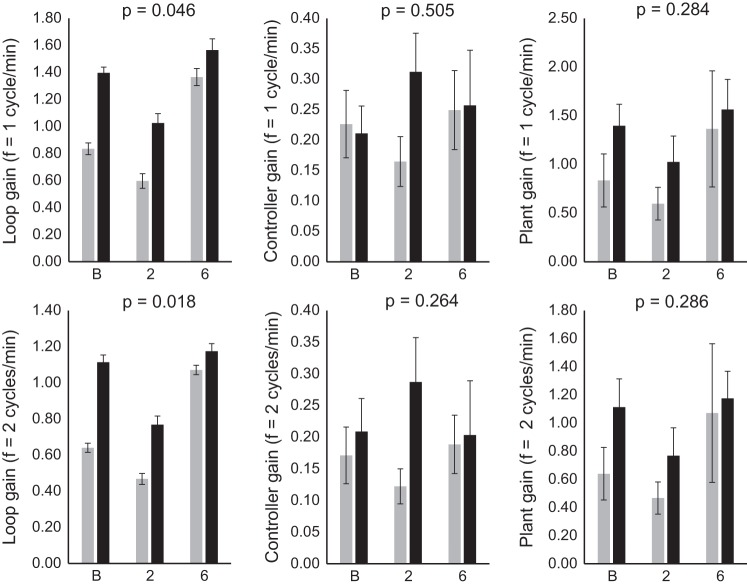
Fig. 2.
Loop gain parameters in obstructive sleep apnea (OSA) and control participants at each visit. Loop gain, controller gain, and plant gain were calculated at one (top) and two (bottom) cycles/min measured at baseline (B), and after 2 and 6 wk of continuous positive airway pressure (CPAP) use in OSA patients (black) and in age- and body habitus-matched controls without CPAP treatment (gray). P values indicate main significance between groups. Values are expressed as means ± SE; n = 7 OSA; n = 8 non-OSA.

