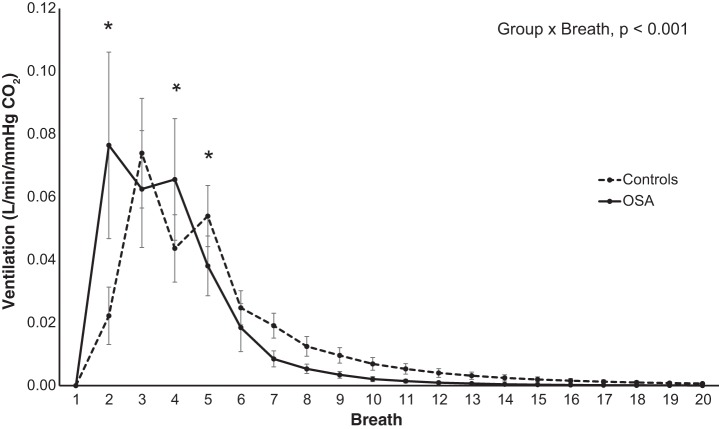
Fig. 3.
Estimated impulse responses to a sudden change in CO2. Estimated chemoreflex impulse response across visits over the first 20-breath period for obstructive sleep apnea (OSA) patients (solid) and matched controls (dashed). *Significant post hoc differences between groups (P < 0.05). Values are expressed as means ± SE; n = 7 OSA; n = 8 non-OSA.

