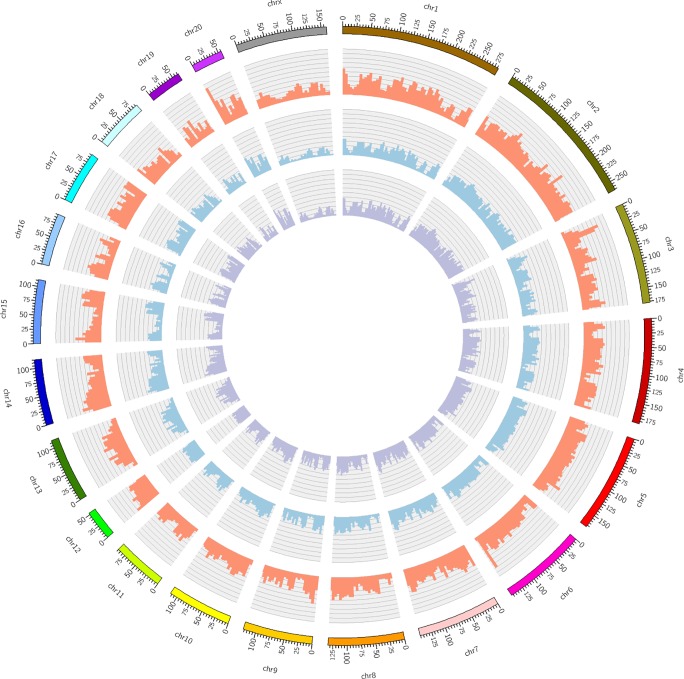
Fig. 5.
Genomic variant densities of SS/JrHsd/Env, SS/JrHsd/Mcwi, and SS/Jr rats. Shown is a Circos plot representing the genomic variant densities of the SS/JrHsd/Env, SS/JrHsd/Mcwi, and SS/Jr rat strains. Each colored bar on the outermost ring represents a single rat chromosome (chr) with each tick mark denoting a physical distance of 5 Mb. The inner whorls contain histograms, which represent the total number of genomic variants per 5 Mb of the SS/JrHsd/Env (red), SS/JrHsd/Mcwi (blue), and SS/Jr (purple) rat genomes compared with the Rnor_6.0 reference genome (Brown Norway strain; https://www.rgd.mcw.edu/; accessed June 1, 2018). The histograms in each of the three inner whorls are represented on the same scale (0–40K). SS/JrHsd/Env, salt-sensitive rats developed by John Rapp, distributed by Harlan, and purchased from Envigo; SS/JrHsd/Mcwi, salt-sensitive rats developed by John Rapp and bred in Milwaukee; SS/Jr, salt-sensitive rats developed by John Rapp and bred in Toledo.

