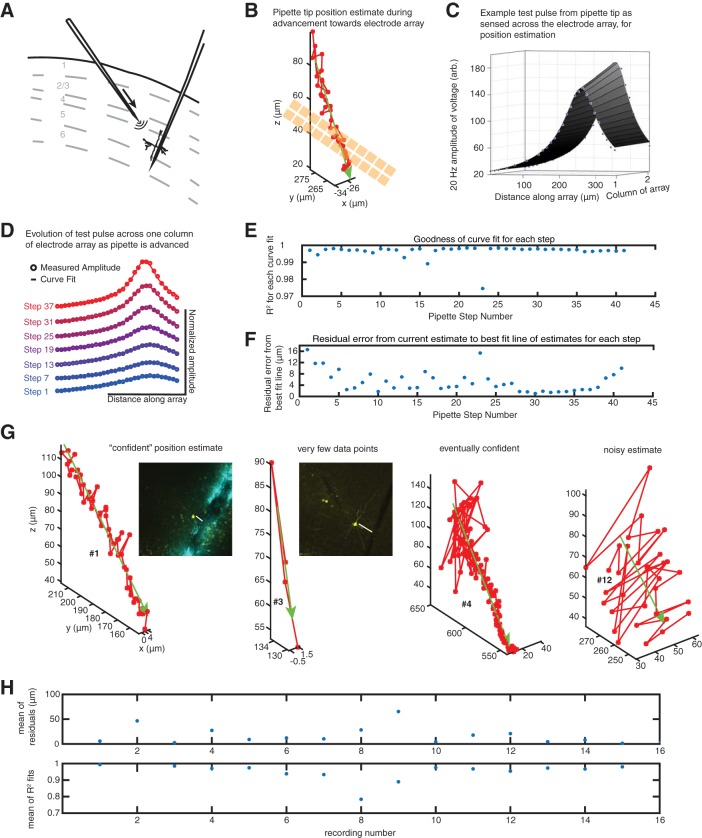
Fig. 1.
A strategy for dual automated patch clamp and extracellular electrode array recordings in vivo. A: schematic of mouse cortical layers (gray dashed lines) with an electrode array inserted perpendicularly to the brain surface (from top right). A patch pipette targets a neuron (from top left) in either layer 2/3 or layer 5, with the goal of having the electrode array and patch pipette colocalized (i.e., recording activity of the same neuron). Curves emanating from pipette represent current emitted from the pipette for sensing on the electrode array. B: pipette tip-to-electrode array distance prediction from computational model. As the pipette is lowered toward the array (gold squares) in discrete 2-um steps, distance is estimated (red circles, with a green best-fit line across data points), shown for an exemplar recording (data in C–F also correspond to this recording). C: 20-Hz amplitude of a voltage pulse from the pipette as sensed across the electrode array (blue dots represent electrodes), and 1/r curve fit (surface plot). Electrode spacing on the array was 11 μm between adjacent electrode centers. D: amplitude (circles) and curve fit (solid lines), illustrated for a single column of the electrode array, as the pipette approaches the array in discrete 2-μm steps. E: goodness of fit for our 1/r model during each step as the pipette approaches the electrode array. F: at each step, a distance between the pipette tip and the electrode with the largest 20-Hz amplitude signal is approximated. Residual error to a best-fit line that estimates the 3-dimensional (3D) trajectory of the pipette tip in space is calculated post hoc (blue dots). G: position estimates, as in B, for 4 of the 16 recordings in which the model was used, illustrating varying “confidence” in the model. Number labels (#) correspond to recording number in H. Histology for the 2 recordings in which both the patched neuron was recovered (left) and the track from the electrode array was apparent (2nd from left) are shown, with biocytin-filled neuron in yellow (and DiI from the array in cyan for left experiment). Distances indicated between the neuron and the electrode array are 40 and 75 μm, respectively. H: mean, over all pipette steps, of residuals (top) and mean of R2 fits (bottom) for each of the 16 recordings in which the model was used.

