Fig. 3.
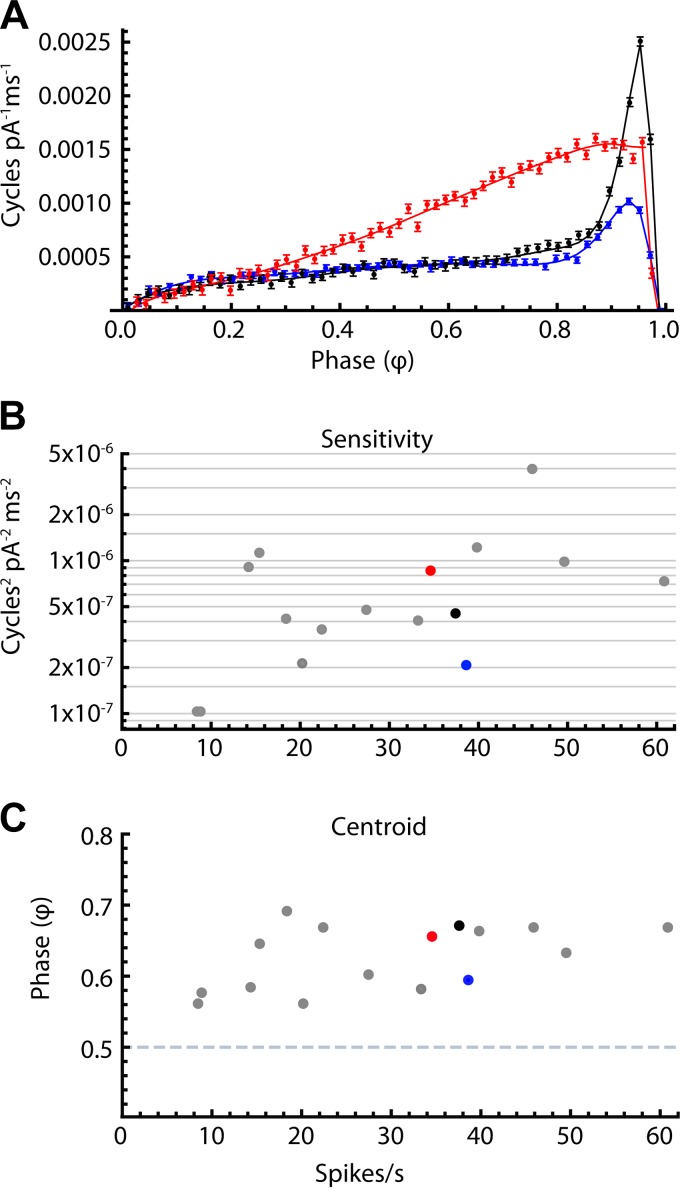
Phase-resetting curve (PRC) variation among substantia nigra pars reticulata (SNr) neurons. A: 3 example PRCs from neurons with similar firing rates: blue, 38.6 Hz, black, 37.5 Hz, and red, 34.6 Hz. For all neurons, sensitivity to stimulus current was low at early phases, and generally peaked at a late phase before falling rapidly at phases approaching 1. Both the mean amplitude and the shape of the PRC varied among cells. B: overall sensitivity vs. mean firing rate for all cells. Colored dots correspond to the PRCs in A. Sensitivity was quantified as the mean squared PRC value across all phase bins. There was no significant correlation between mean firing rate and sensitivity (r2 = 0.16, n = 16). C: centroid vs. mean firing rate for all cells. The mean centroid phase was 0.63 (SD = 0.04). There was no significant correlation between mean firing rate and centroid (r2 = 0.23, n = 16).

