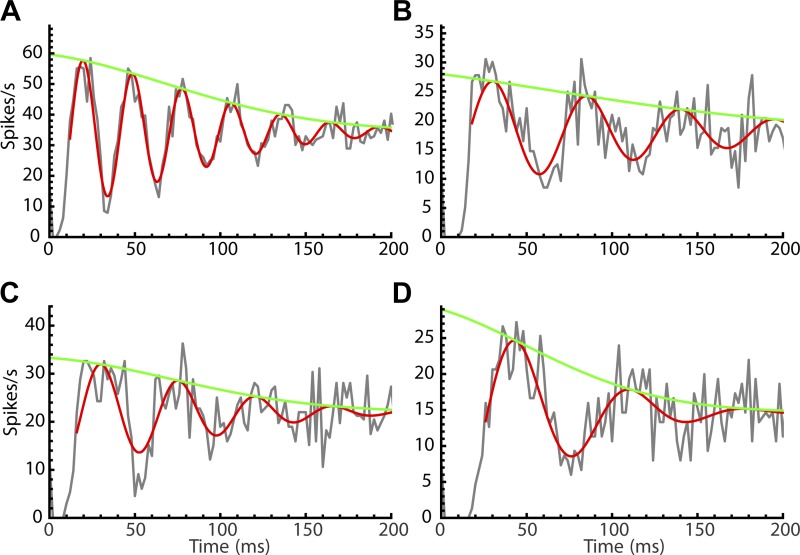
Fig. 9.
A quantitative explanation of poststimulus time histogram (PSTH) oscillation damping by jitter and wander. A–D: experimental PSTH data fitted with Eq. 9 (the amplitude envelope) and Eq. 10 (the damped sine wave). The jitter [j = interspike interval coefficient of variation (CV)] and wander (w = firing rate CV) were measured from periods of unperturbed firing interspersed in each experiment. A: cell 1: j = 0.065, w = 0.051. B: cell 2: j = 0.071, w = 0.083. C: cell 3: j = 0.104, w = 0.057. D: cell 4: j = 0.130, w = 0.136.

