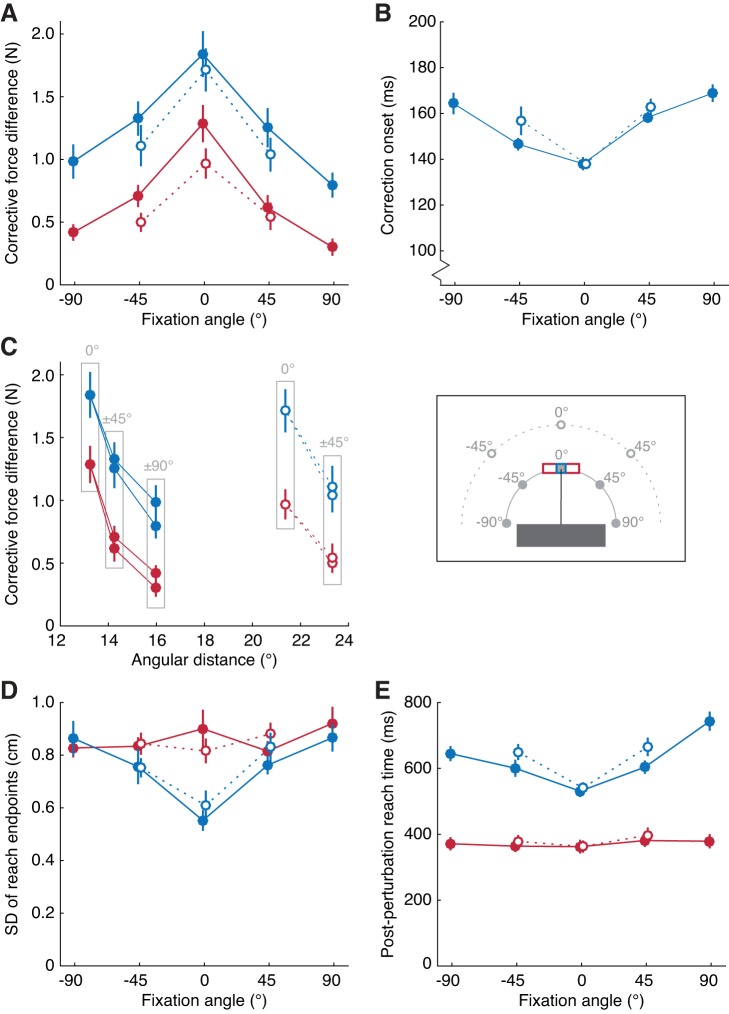
Fig. 3.
Group-averaged results. Blue dots and lines correspond to reaches to narrow targets; red dots and lines correspond to reaches to wide targets. Continuous lines and filled dots correspond to “near” fixation targets (12.5 cm from the point where the cursor, on average, exits the occluder); dotted lines and open dots correspond to “far” fixation targets (22.5 cm from the perturbation point). A: mean force differences averaged across the 180- to 230-ms interval following cursor perturbation, as a function of the angle of fixation relative to the movement direction in the horizontal plane (see inset). B: mean onset of the corrective force response (see Data Analysis) as a function of fixation angle. C: mean force differences as in A, as a function of the distance between the perturbation point and the fixation target in visual angle (see Data Analysis). Labels indicate the angle of fixation relative to the movement direction in Cartesian coordinates. D: mean variability in the horizontal coordinate of the reach end point in nonchannel trials, as a function of fixation angle. E: mean duration between the perturbation and the cursor reaching the target in nonchannel trials, as a function of fixation angle.

