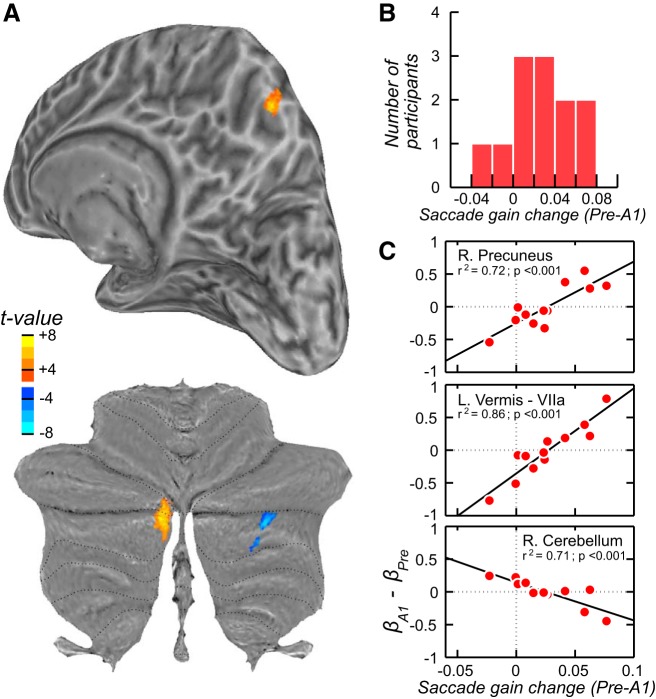
Fig. 3.
Cortical and cerebellar activations related to adaptation of saccades. A: results of the group analysis for the contrast between the Preadapt and A1 (Adapt) phases. During the first phase of Adapt when the saccade gain decreased the most, blood oxygen level-dependent (BOLD) signal increased in the oculomotor vermis (lobule VIIa) and on the medial wall of the parietal cortex, in the right precuneus. There was also a decrease in activity in the right cerebellar hemisphere (lobule VIIb/Crus 2). B: mean gain change between these 2 phases for each participant, which was entered as a covariate in the general linear model (see materials and methods). C: for each cluster in A, we graph the covariation between the change in BOLD signal (β) during saccade adaptation and the degree of saccade gain change during adaptation.

