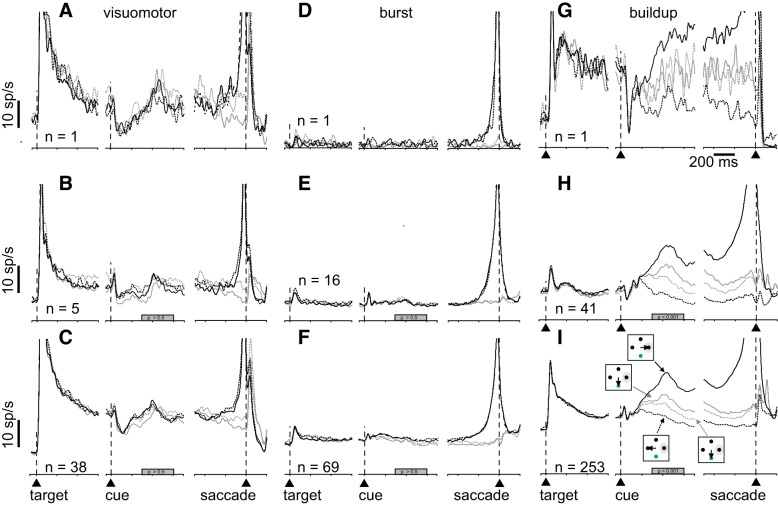
Fig. 2.
Superior colliculus (SC) neuronal activity correlates with confidence reports in an opt out confidence task. A: spike density functions (SDF; σ = 10 ms) plotted over time for an example visuomotor SC neuron recorded during performance of the Stimulus-Matched task. Iconography in I shows the different trial types. Solid black lines show SDFs for correct choices into the response field (RF), opt-out (OO) waived; dashed black lines show SDFs for correct choices away from the RF, OO waived; solid gray lines show SDFs for trials in which the monkey selected the OO choice with motion direction toward the RF; and dashed gray lines show SDFs for trials in which the monkey selected the OO choice with motion direction away from the RF. The SDF panels are aligned to the onset of the choice targets (leftmost; arrowhead and vertical dashed line), when the motion direction cue appeared (middle, arrowhead and vertical dashed line), and when the choice was reported (rightmost, arrowhead and vertical dashed line). D and G: same as in A for burst (D) and buildup neurons (G). B, E, and H: same as in A, D, and G for the average single neurons recorded from 2 monkeys. C, F, and I: same as in A, D, and G, and B, E, and H: for neurons recorded as mixed single neurons and multiple neurons from 2 monkeys. The filled gray bars on the abscissas in B and C indicate the interval of discharge that was quantified (P > 0.5 in C and F; P < 0.05 in I). Vertical scale bar = 10 sp/s; horizontal scale bar = 200 ms.

