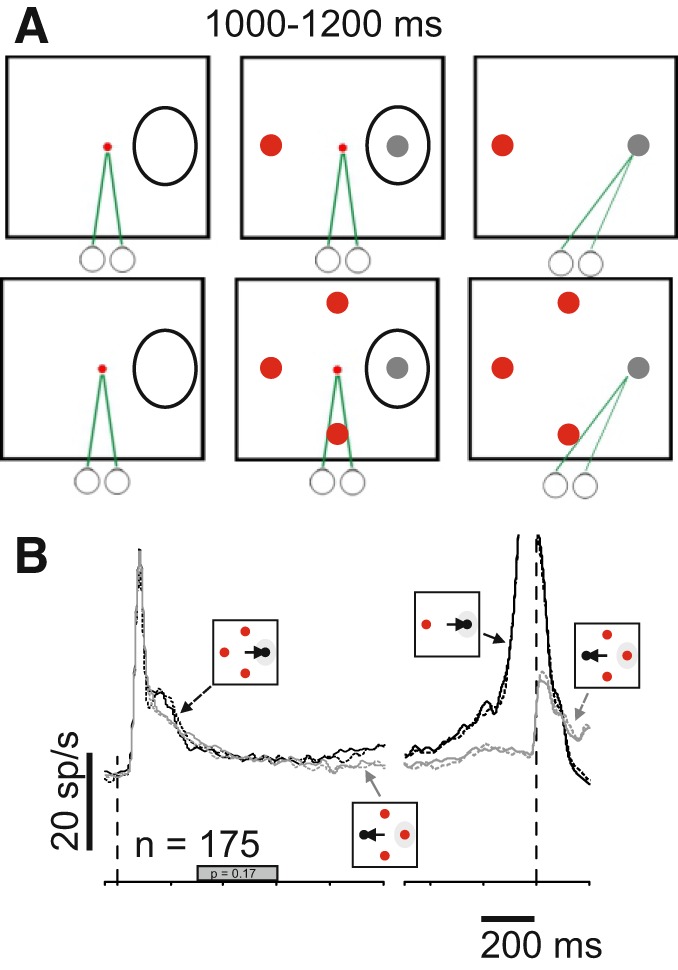
Fig. 4.

Lateral inhibition fails to explain confidence activity in the superior colliculus (SC). A: schematic of the spatial arrangement and timing of the odd-ball task used to assess stimulus display interaction effects on SC neuronal activity. The squares show the screen and the black ovals indicate the response field (RF) of the recorded neurons. The circles below the squares and the green lines show the direction of gaze. On randomly interleaved trials, either 2 or 4, isoluminant red distractor(s) and a gray target appeared on the screen. After a delay of 1,000–1,200 ms, the centrally located fixation spot (small red circle) disappeared, cueing the monkey to shift its gaze to the odd-ball target. The colors in figure are for display purposes only. During the experiment the background of the screen was black, fixation spot was red, the distractors were red and the target gray, to match the luminance of the distractors (materials and methods). B: average spike density function (SDF) plotted over time for the 175 single and multiple SC neurons recorded while monkeys performed the odd-ball task shown in A. Iconography indicates the trial types. Solid black lines show SDFs for correct choices into the RF with 2 possible targets and dashed black lines show SDFs for correct choices into the RF with 4 possible targets. Solid gray lines show SDFs for correct choices away from the RF for 2 possible targets, and dashed gray lines show SDFs for correct choices with 4 possible targets. The filled gray bar on the abscissa indicates the interval of discharge that was quantified. Note that there is no difference between 2 and 4 possible targets because there is no uncertainty in the saccade choice (P > 0.05; Basso and Wurtz 1997, 1998).
